Global analytics platform
for humans and agents.
Market data, a full quantitative analytics engine, native AI and the whole desk workspace — on one stack, on one login.
Ask a market question.
Get a number back.
Not a chat box and not a chart. You send a small JSON object, it returns a typed answer — a probability, a pick with odds, a score, a ranking or a figure — with the working attached. Priced per call, so it costs nothing to find out.
{
  "symbol": "NVDA",
  "questions": {
    "overbought": { "type": "yes_no", "ask": "rsi > 70" },
    "trend_up":   { "type": "yes_no", "ask": "C > sma_50 and sma_50 > sma_200" },
    "atr_pct":    { "type": "amount", "of": "atr_pct(14)", "round": 2 }
  }
}
{
  "status": "ok",
  "answers": {
    "overbought": 0.0898,
    "trend_up":   0.8392,
    "atr_pct":    2.68
  }
}
Three questions, one price history, one bill — about $0.002. 0.0898 is a firm no; 0.8392 is a yes with a caveat; 0.5 would mean the numbers do not tell you, which true-or-false can never say.
AI is not a chat box in the corner.
It is how the platform is used.
Every app, every symbol and every one of the 160+ commands is reachable by an agent, because the AI layer was built on the catalogue rather than pointed at it from outside. It answers from your data — your watchlists, your portfolios, your uploaded filings — and it cites what it used.
Any screen, any symbol, any filing — in your own words, with the working shown and the source cited.
It does not just answer. It opens the screen, runs the scan, builds the watchlist and files the task.
The output is a document your desk can send — a matrix, a report, a deck — not a paragraph you retype.
Ask in plain English and get an answer built from your own watchlists, portfolios, screens and filings — not from a model guessing at prices it half-remembers.
One prompt, run down a whole universe. Ask two hundred companies the same question and get a grid back, every cell traceable to the filing it came from.
Custom reports written to your brief — the coverage note, the screen write-up, the morning summary — generated on the same numbers the charts use.
Drop in your own PDFs, decks and filings. They are indexed and answerable alongside the market data, with citations back to the page.
160+ commands, JSON out. The same catalogue your analyst clicks is one ka call away from a script, a notebook or an LLM tool definition.
A native MCP server, so Claude, ChatGPT or your own agent can use KlickAnalytics as a tool without anyone writing a wrapper.
Put the agent on a schedule. The run happens at 4am, the output lands in your notification centre, and nobody had to remember to click anything.
Teach the assistant your desk's method once — how you size, what you screen for, how a note is laid out — and it applies it every time.
When the question is too specific for a screen, query the catalogue directly — and let the AI write the query for you.
All of it is included in the one subscription — no AI add-on tier, no separate seat. Bring your own model through MCP, or use ours.
Save $30,000 a seat, a year.
A seat on the incumbent terminal is $30,000 a year, so most desks buy a handful and share them. Here everyone gets their own login for $199 a month — the analyst, the risk person and the PM all at once.
Today
One seat, shared. Most of the team waits their turn.
On KlickAnalytics
Everyone gets their own login, at one flat price.
One universe. 86,000+ instruments.
Every asset class normalised into the same symbol model with adjusted history — so a chart, a screen, a correlation or a backtest can cross asset classes without you rebuilding the data first. Pick one and see exactly what you get.
Stocks
Global listed equities with split- and dividend-adjusted history, full fundamentals, and everything that moves them.
What you get
- Adjusted OHLCV history
- Income statement, balance sheet, cash flow
- Estimates, revisions and price targets
- Ratings, ownership and insider activity
ETFs
Exchange-traded funds screened, charted and broken open — categories, dividends and the holdings underneath.
What you get
- Popular, dividend and category screens
- Holdings and overlap by symbol
- Expense, yield and performance metrics
- ETF exposure for any ticker you hold
Funds
Mutual funds, closed-end funds, REITs and MLPs — the vehicles most platforms treat as an afterthought.
What you get
- Mutual fund and closed-end fund universe
- REIT and MLP coverage
- Dividend guidance and increases
- US major fund performance
Options
Not just the chain — the surface. What the market is pricing, how skew leans, and where a strategy actually breaks even.
What you get
- Full chain with greeks
- Implied volatility and IV/HV history
- Expected-move cones and term structure
- Put/call ratio, skew, ten strategy templates
Indices
World equity indices with their components, plus the sector, industry and thematic groupings you can chart against anything else.
What you get
- Global index levels and components
- Sector and industry performance
- Thematic and custom collections
- Heatmaps and breadth views
Currencies
The most liquid market on the planet — spot rates, single-currency strength views and full cross-rate matrices.
What you get
- Spot rates and history
- Single-currency strength views
- Full cross-rate matrix
- FX symbols usable in any tool
Commodities
Energy, metals, softs and agriculturals — both as trading vehicles and as the inflation signal sitting behind everything else.
What you get
- Energy, metals, softs and ags
- Benchmark and spread analysis
- Seasonality across history
- Correlation to equities and FX
Crypto
Majors and the long tail, carried as first-class symbols rather than a bolted-on widget.
What you get
- Majors and long-tail coverage
- Bubble maps and relative strength
- The same charting and backtesting engine
- Cross-asset correlation
Global economics
Releases, revisions and indicators carried as symbols — so a macro series can drive a screen or a backtest, not just a chart.
What you get
- Economic release calendar
- Indicators by country
- Market risk premium series
- Regime and event analysis
Filings & transcripts
The primary documents, searchable and retrievable — including by an agent that has to cite what it read.
What you get
- SEC filings feed, including 8-K
- Earnings call transcripts
- Highlights and keyword search
- Hybrid-retrieval RAG over your own uploads
News & sentiment
Over a million articles, plus press releases, social sentiment and market TV — attached to the tickers they move.
What you get
- Market news and per-symbol news
- Press releases and categories
- Social sentiment scores
- Market TV video coverage
Market internals
Breadth, regime and internal series carried as real symbols — chartable, screenable and backtestable like any stock.
What you get
- Breadth and participation series
- Regime classification symbols
- Threshold and new-high / new-low lists
- Usable inside any formula or backtest
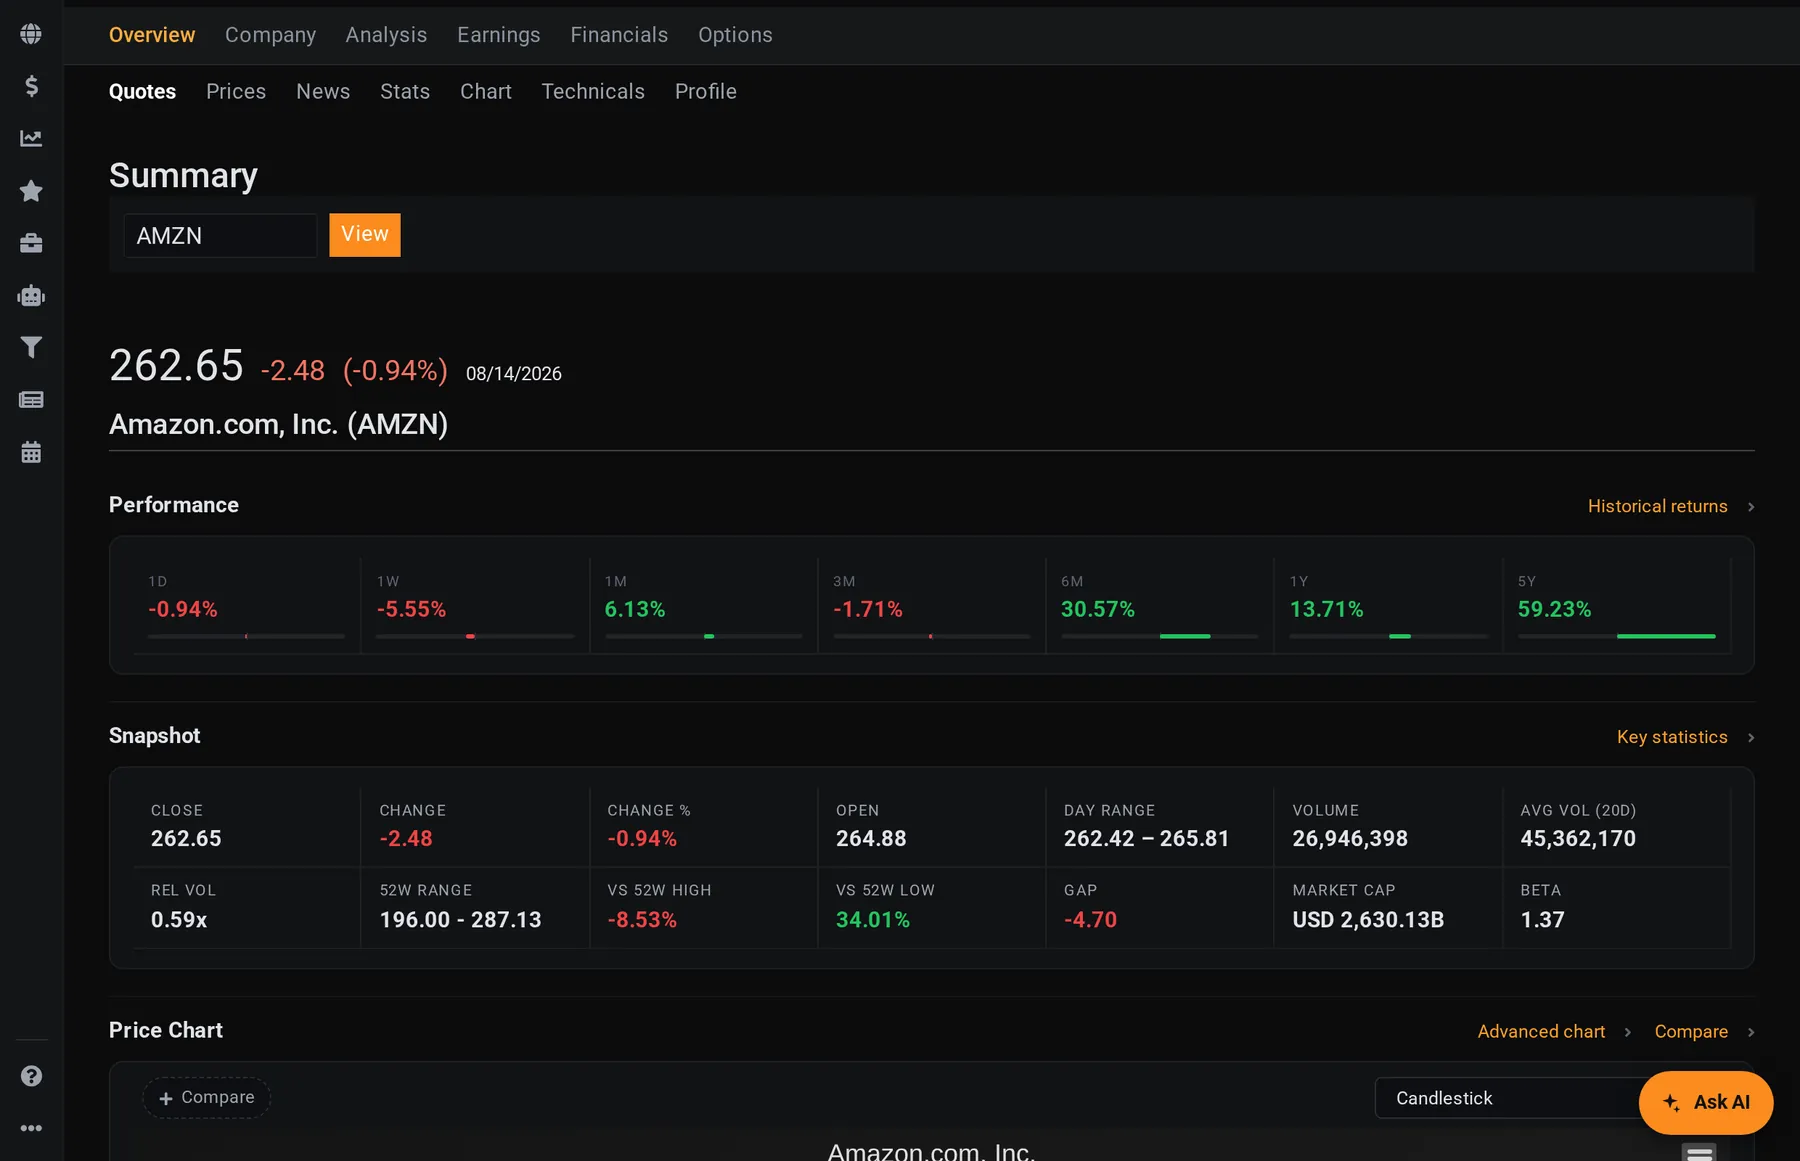
Every company, on one screen.
Price, performance across eight windows, the full snapshot, analyst consensus, earnings history and the chart — before you have clicked anything. The first screen an analyst opens when a name lands on the desk.
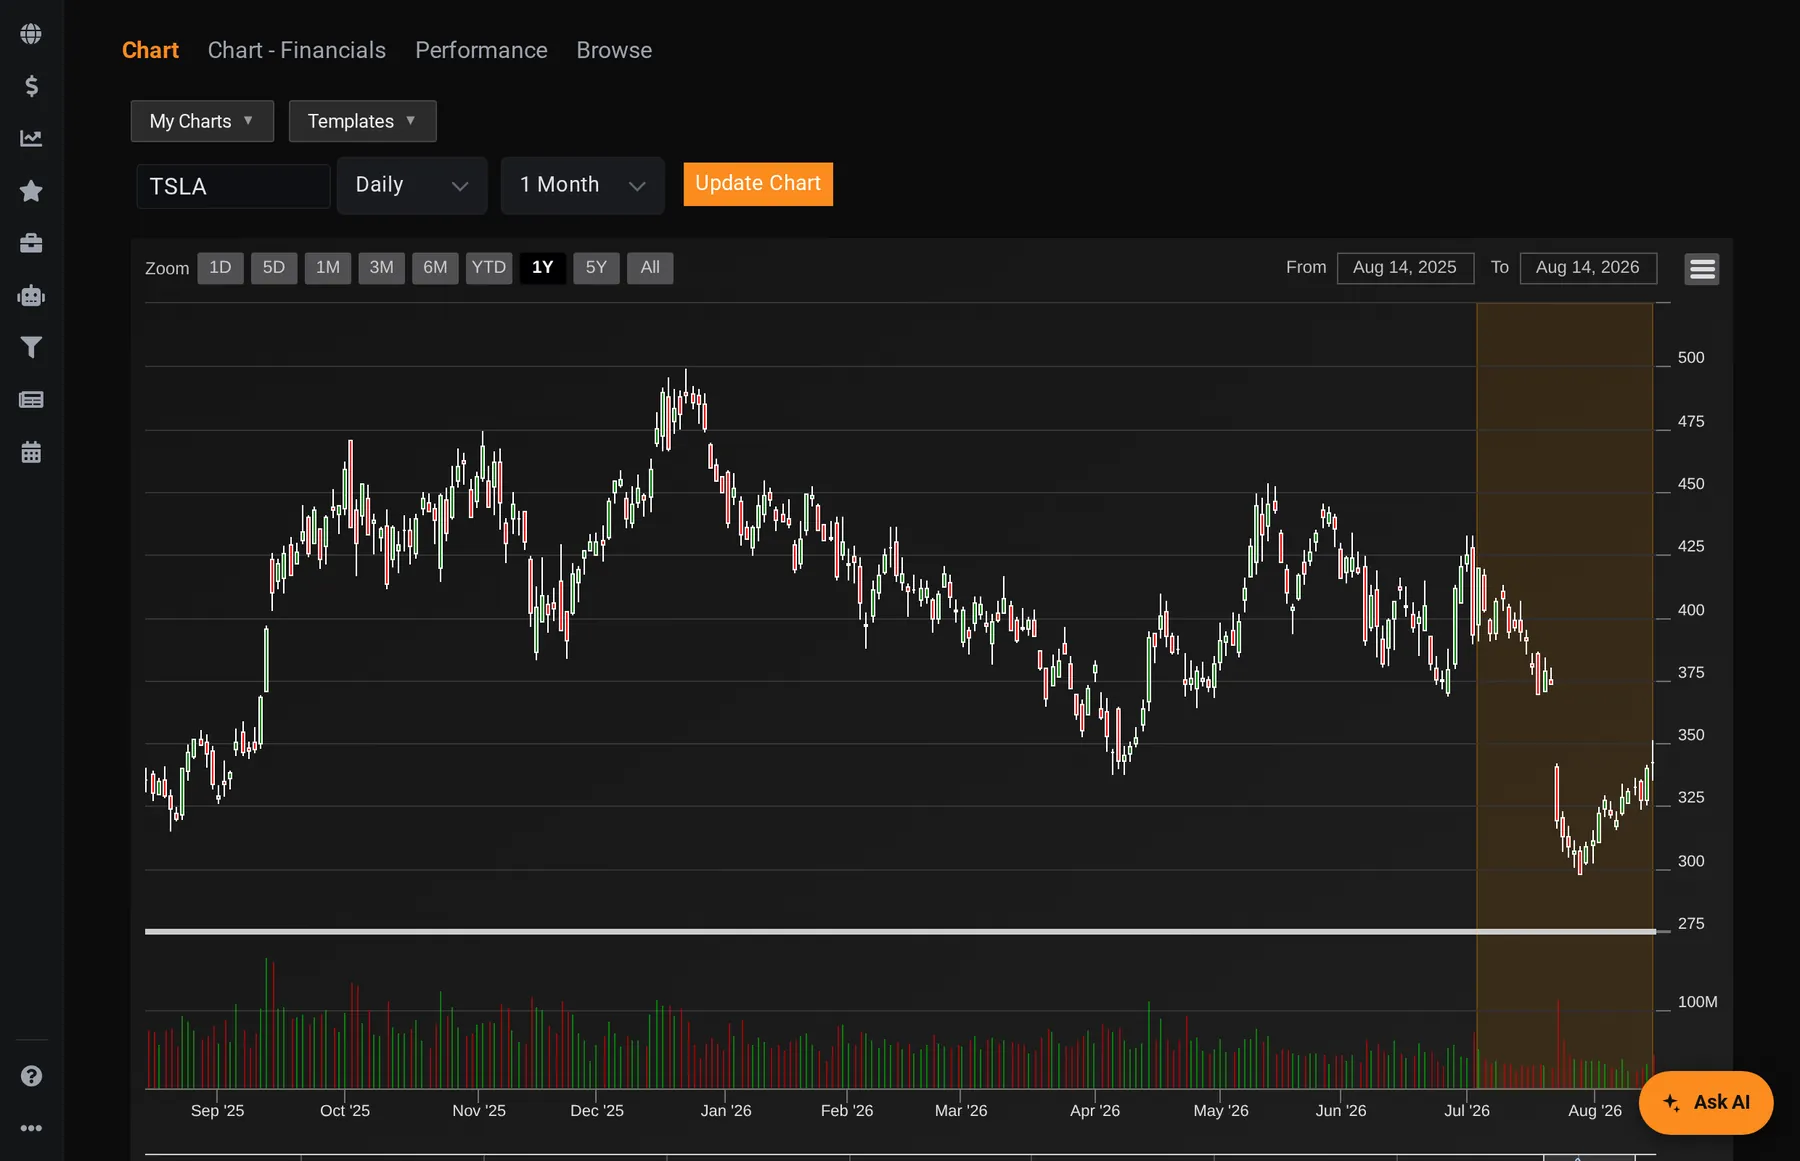
Charting you do not leave the platform for.
Twenty years of adjusted history, drawing tools, auto support and resistance, trendlines and Fibonacci, event markers, streaming prices and a Pine-style scripting layer — on the same chart engine every app uses.
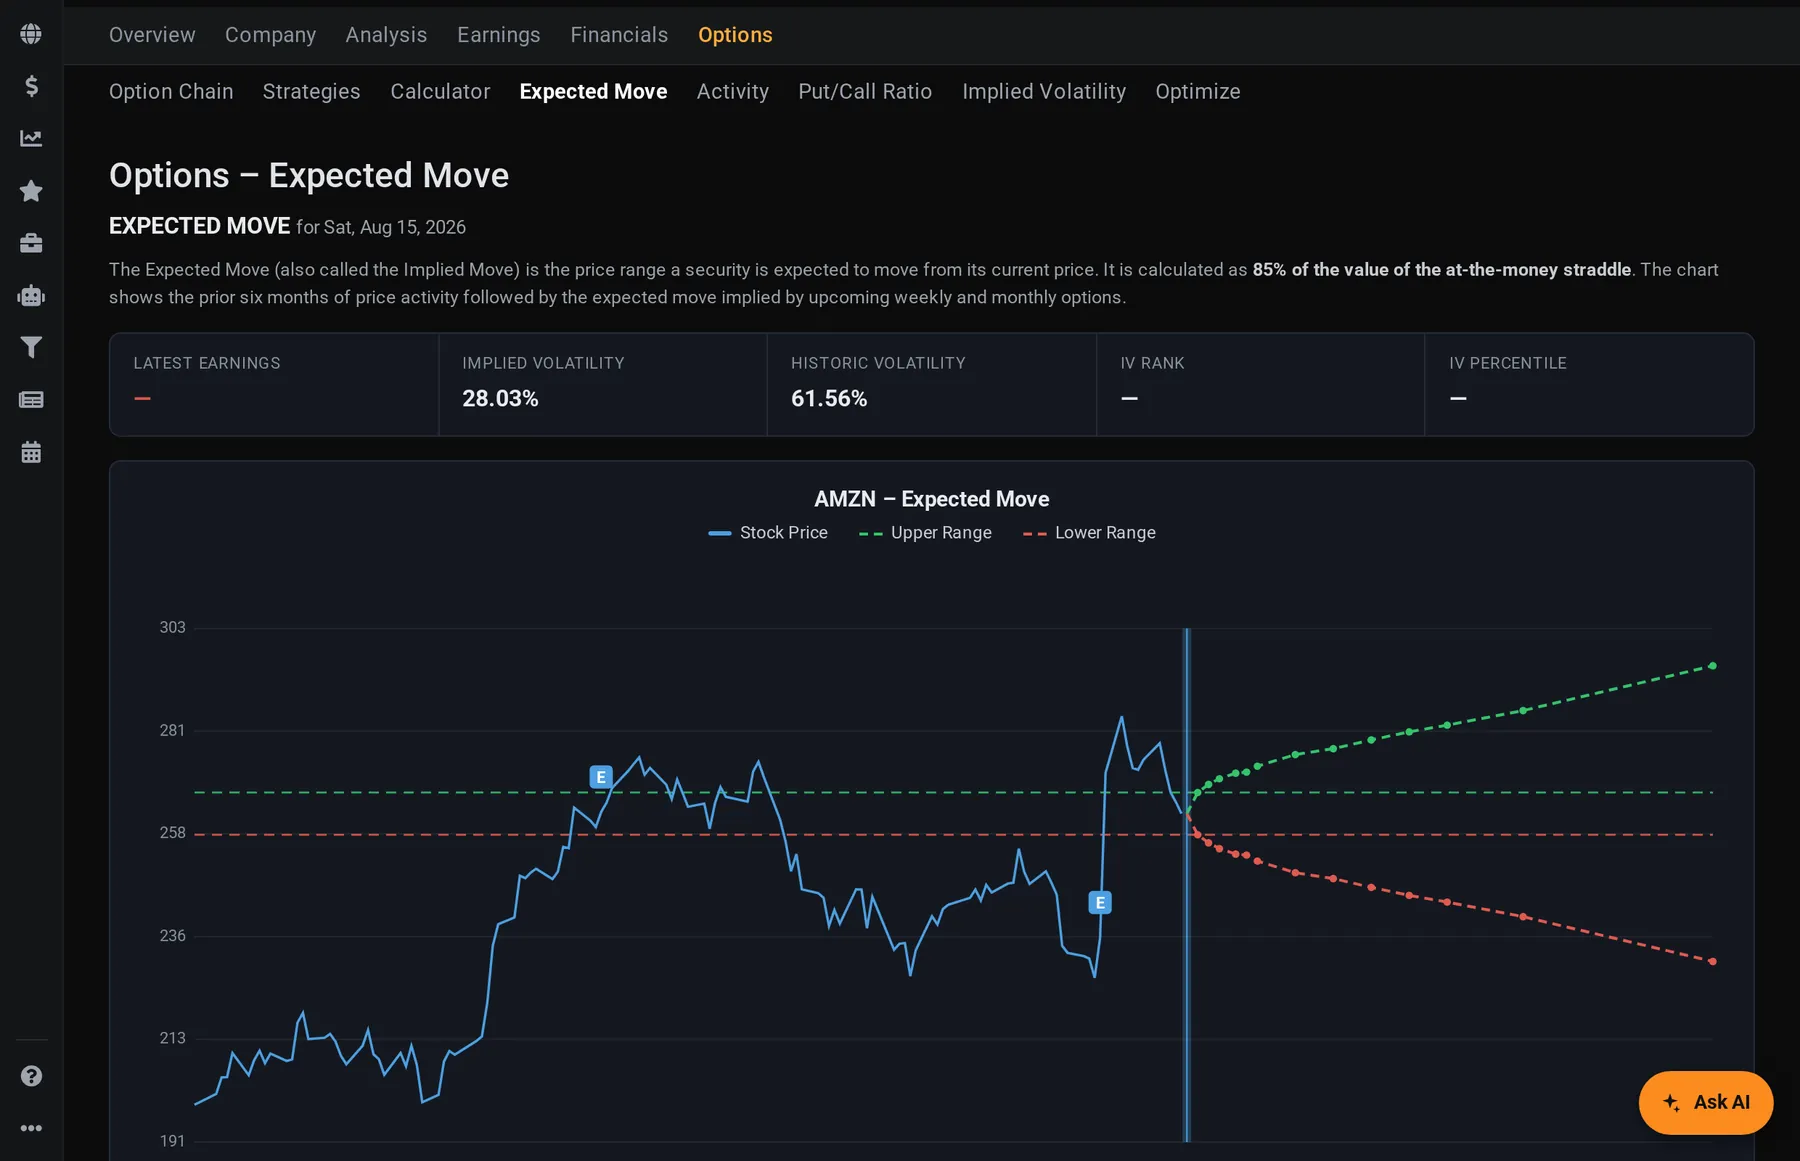
The whole options surface, not just the chain.
What the market is actually pricing: the implied-move cone out to each expiration, implied against historic volatility, skew, put/call ratio and payoff diagrams for ten strategy templates — all computed from the live chain.
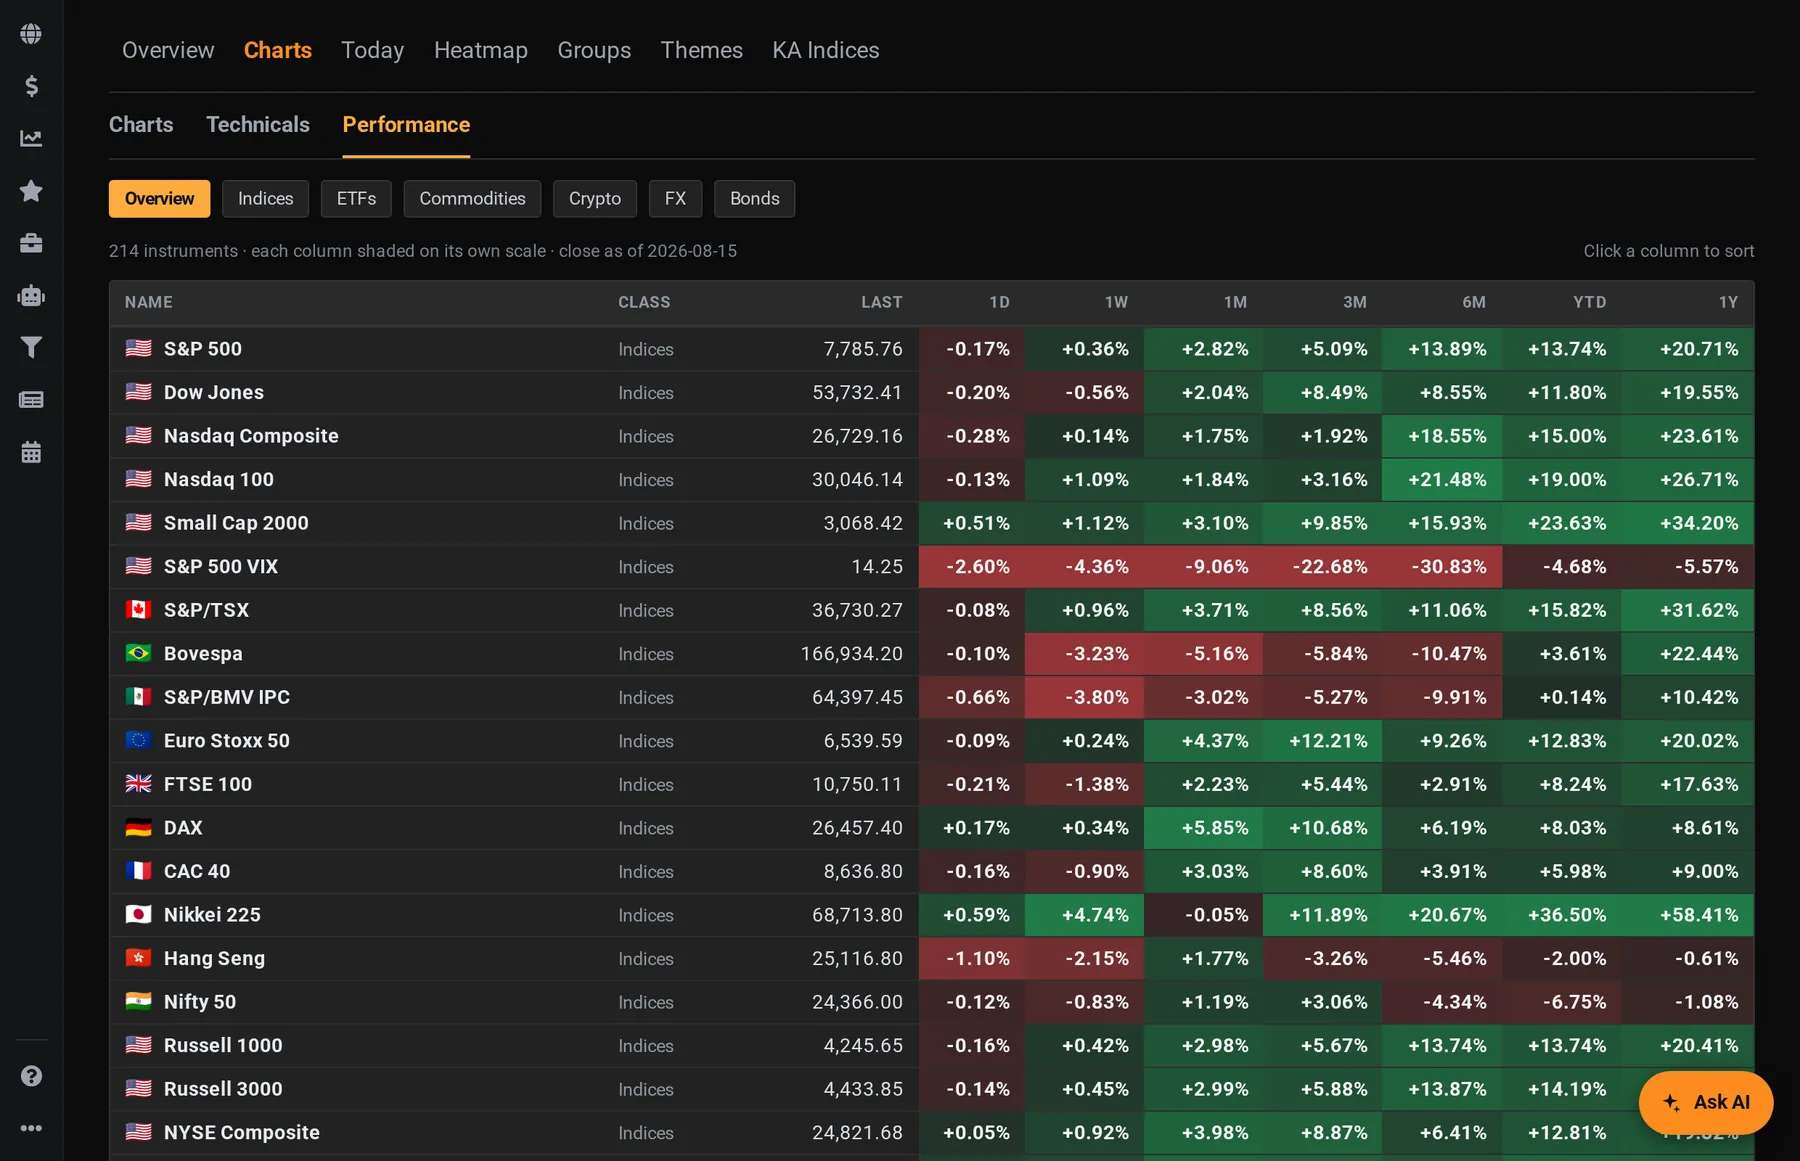
Every asset class in one grid.
Indices, ETFs, commodities, crypto, FX and bonds ranked side by side from one day to one year, each column shaded on its own scale. One screen to answer what is working and what is not.
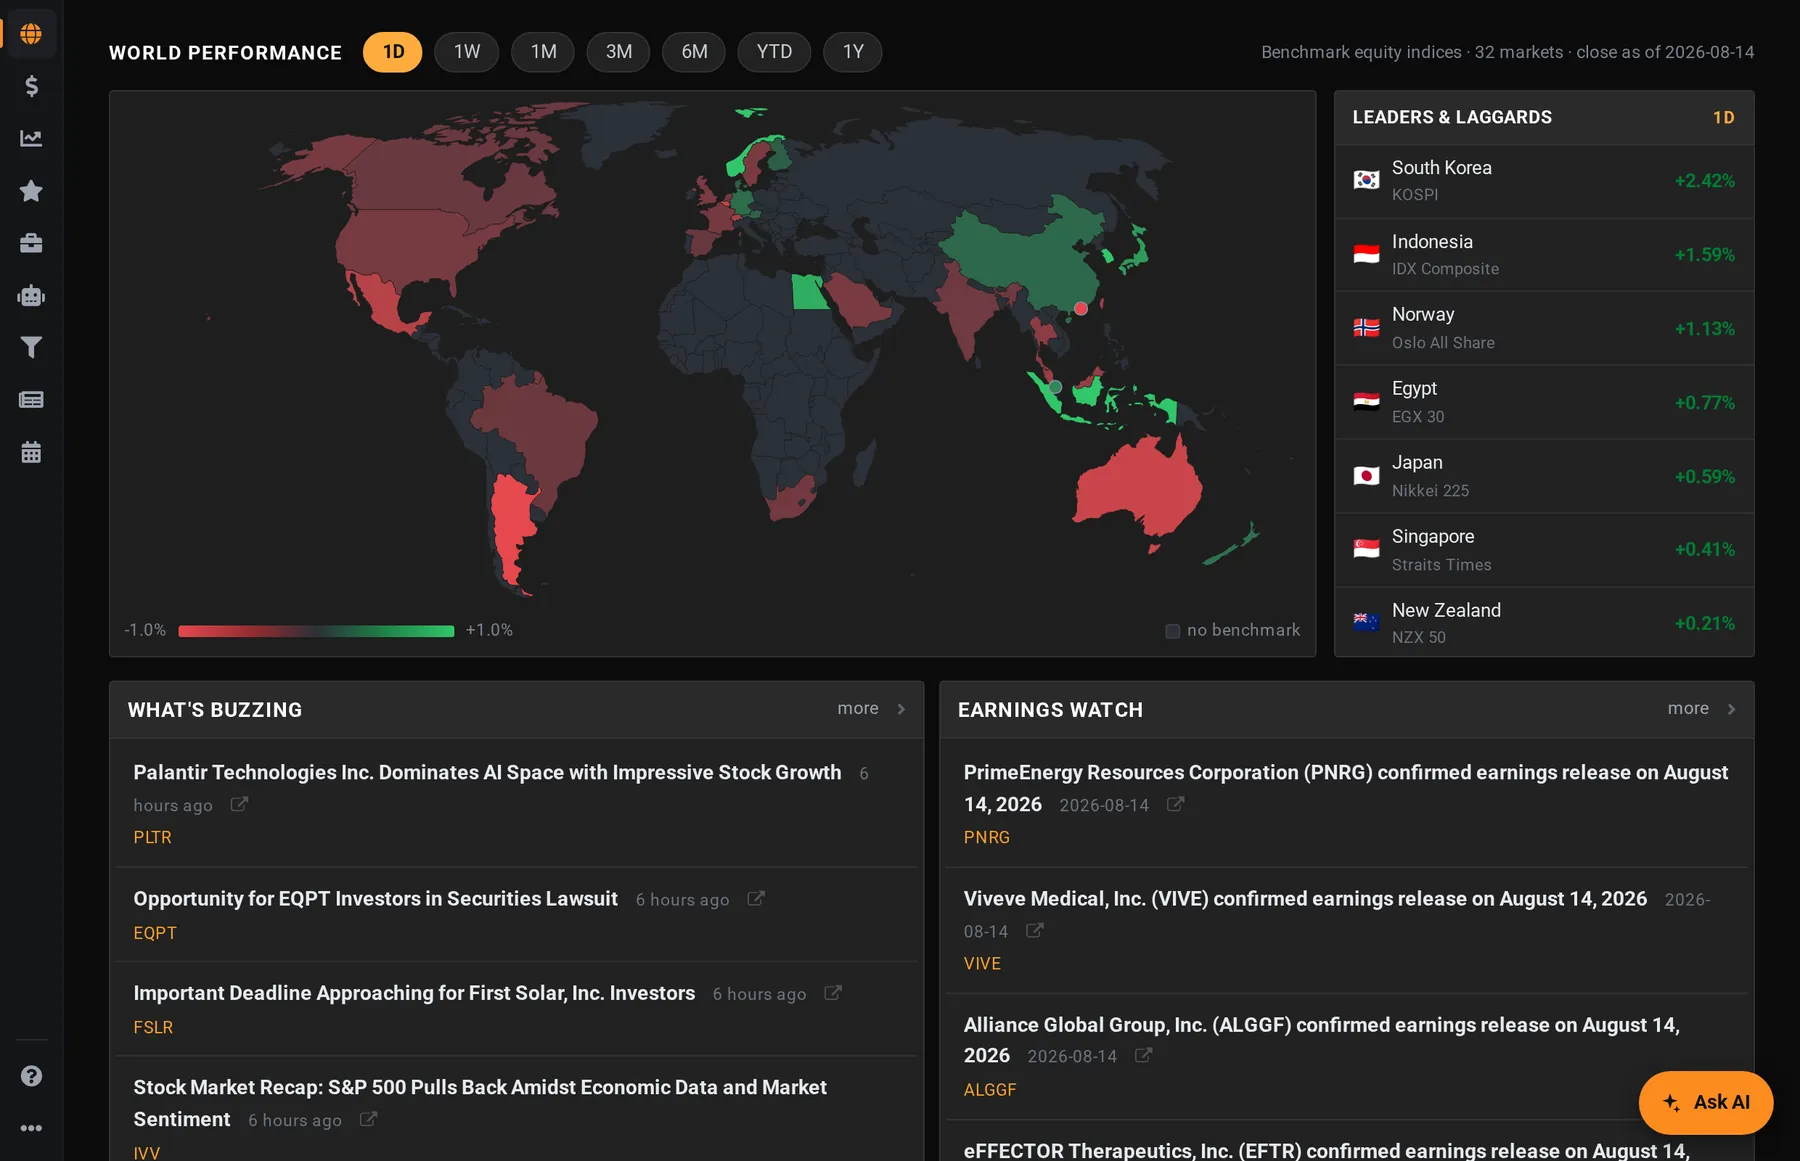
The world, before your morning call.
Thirty-two benchmark indices on a live map with leaders and laggards beside it, over any window from one day to a year — then the same markets as quotes, heatmaps, groups and themes.
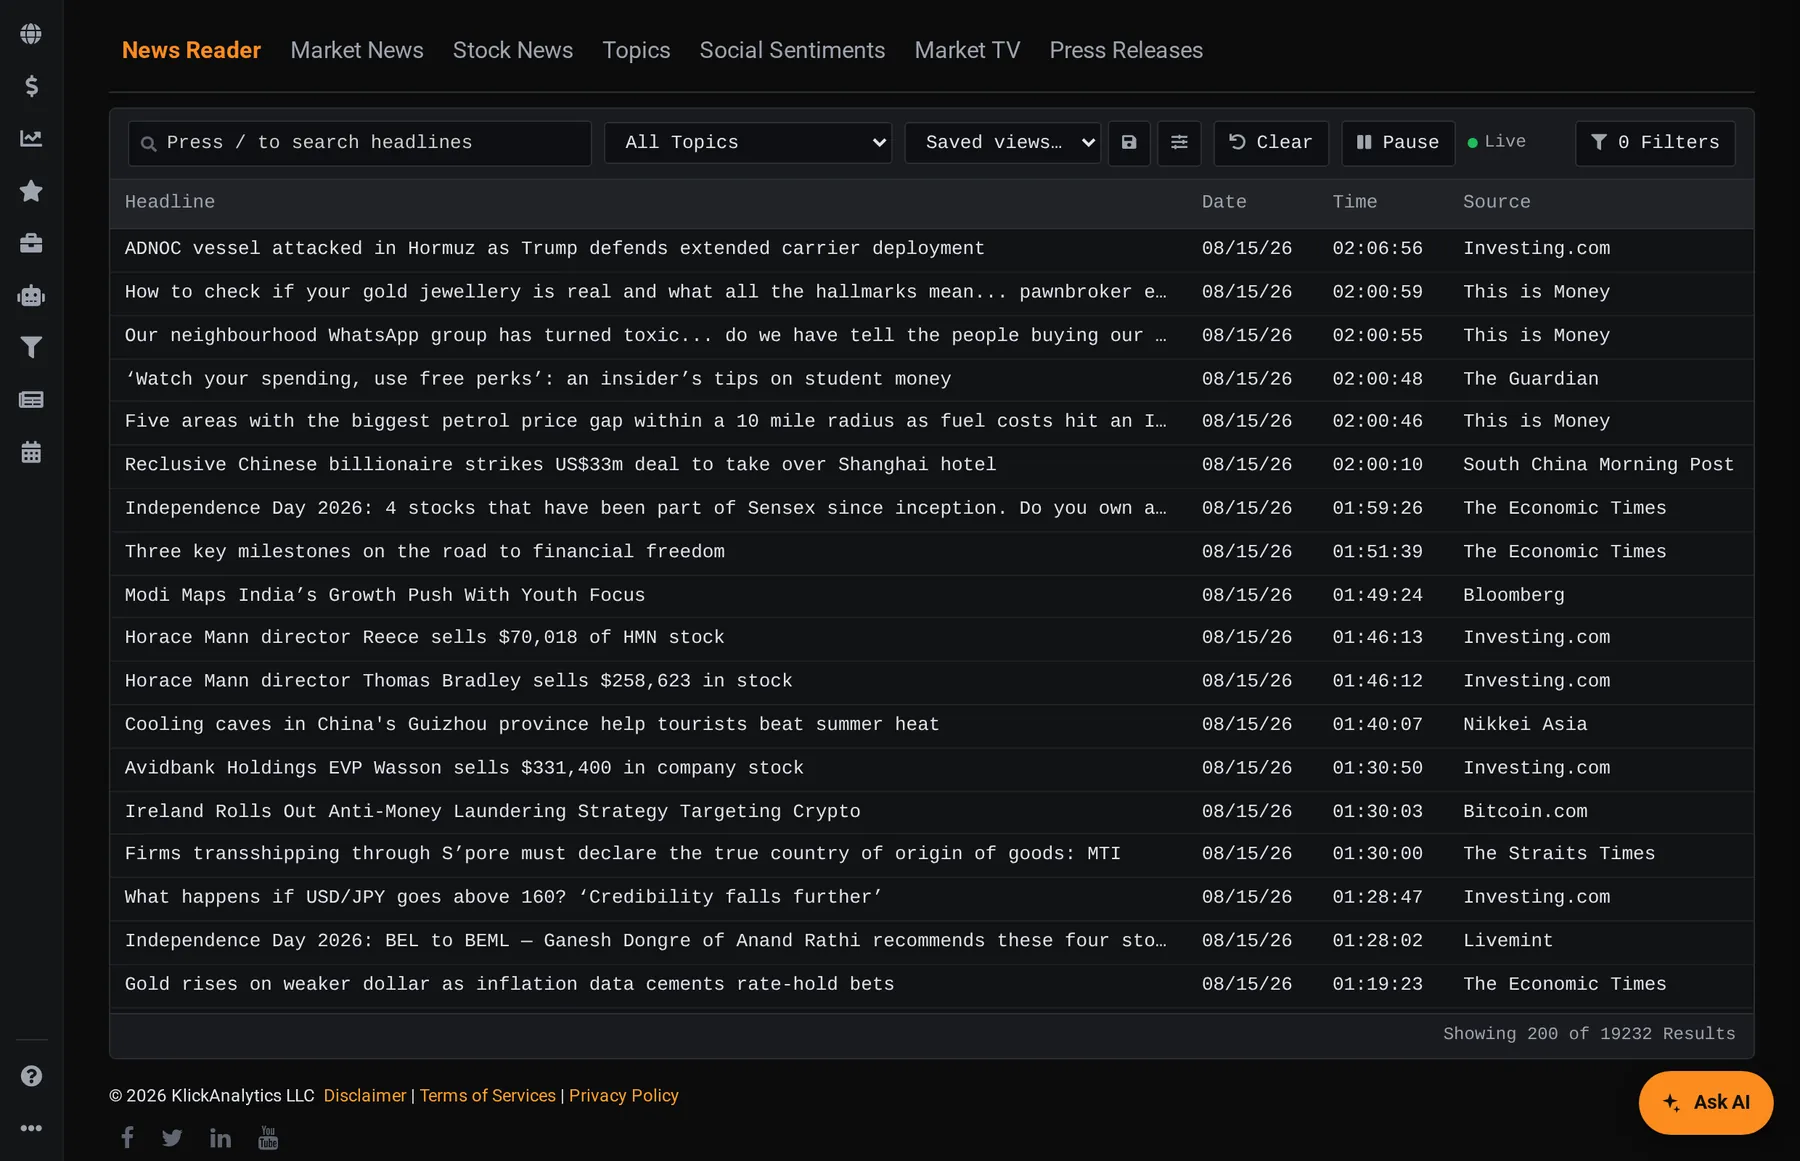
A live wire that filters itself.
Nineteen thousand headlines and counting, streaming in as they land, with saved views, topic filters and instant search — attached to the tickers they move, not a separate destination.
No login needed to look around — most screens above open straight from the browser.
185 research apps. Every one of them callable.
This is not a feature list written for a landing page — it is the live product navigation, rendered from the same source the application uses. Filter it and see what you get on day one.
Symbol-scoped apps inherit whichever ticker you are looking at. Everything shown is included in one subscription.
One engine. Four ways in.
Nothing is exclusive to the interface. The terminal, the CLI, the API and an AI agent all call the same command catalogue — so the answer you get on screen is the answer your pipeline gets at 4am.
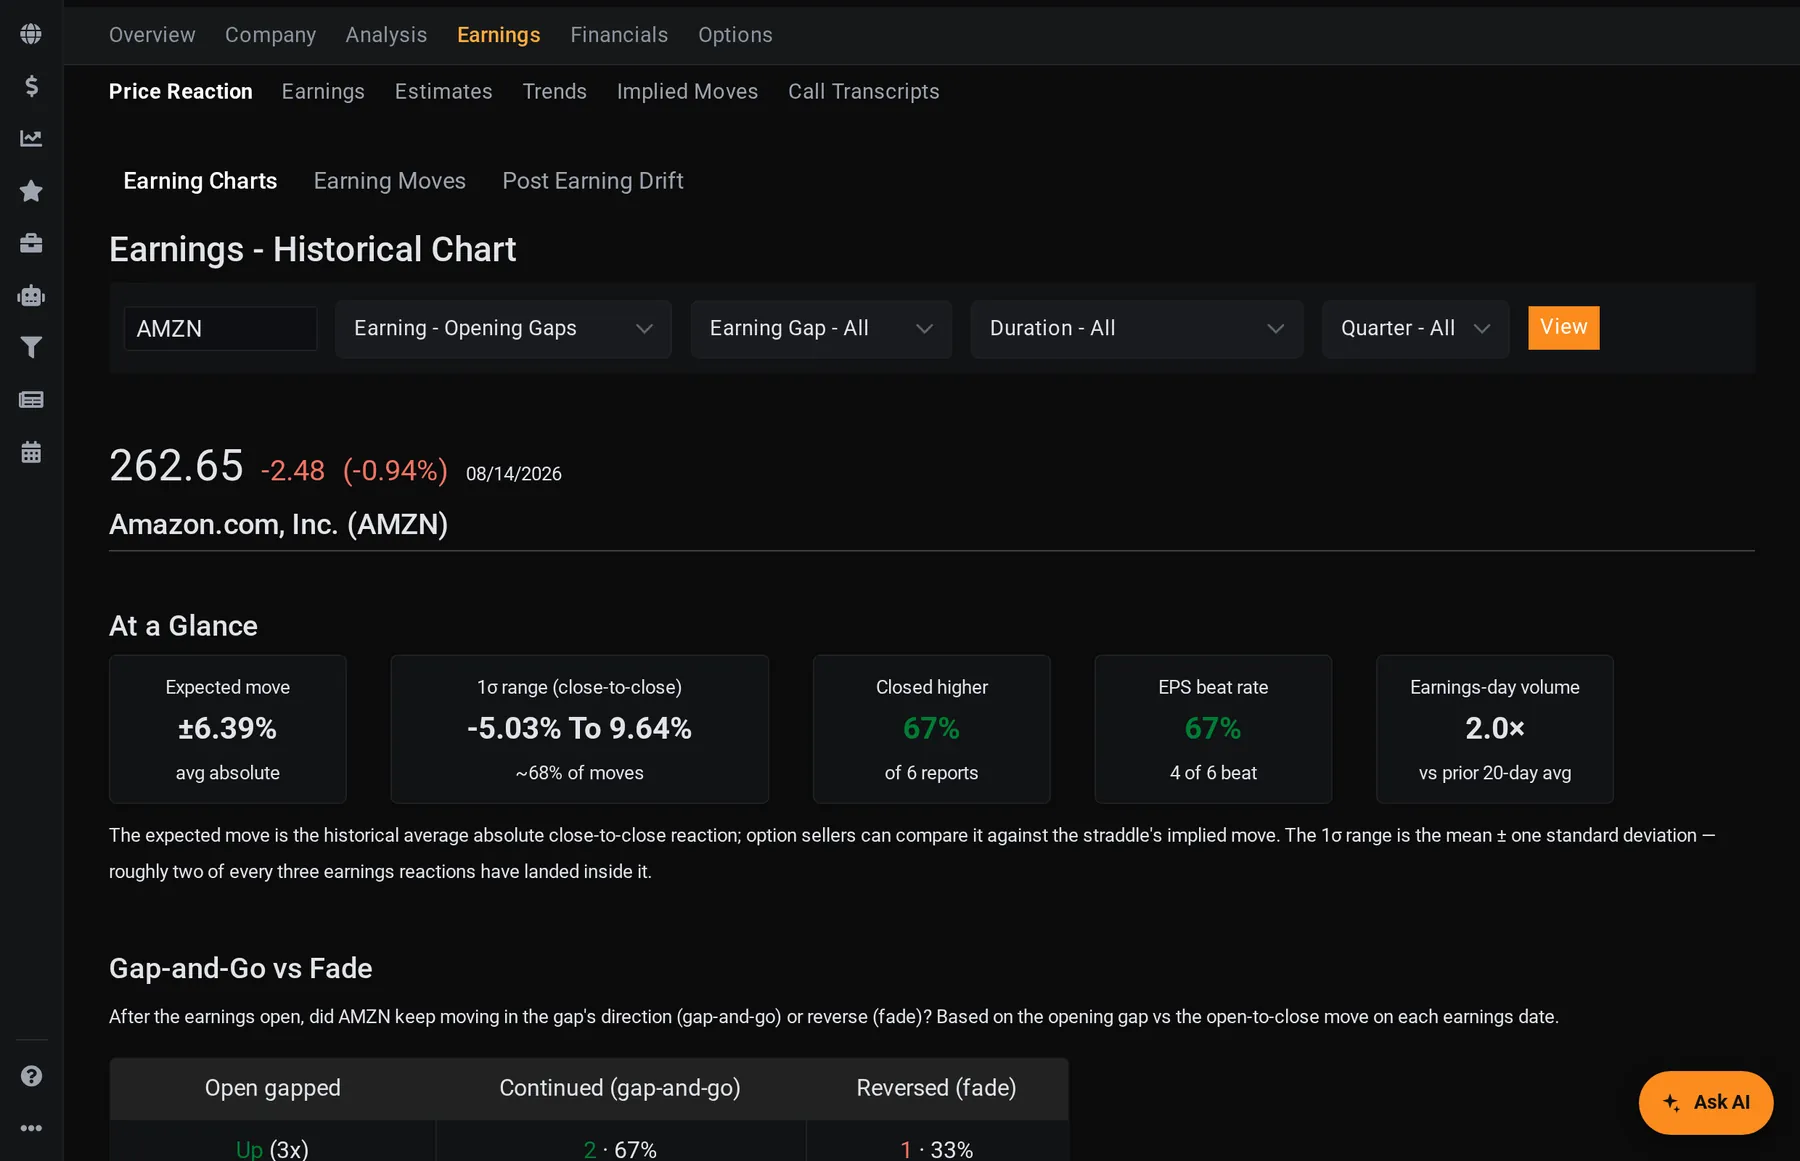
Actual product — Symbol › Earnings › Price Reaction.
ka — installable anywhere you have a shell.
Composition layer for applications and internal systems.
Claude, your own agent, or ours. Same tools.
You do not need Slack, Confluence or Jira.
You already have them here.
A desk does not only do research — it runs. Chat, the wiki, the tracker, the calendar, the CRM and the deck are all built into KlickAnalytics, on the same login as the data. Not integrations pointed at the platform: the same product, built by the same team, sharing the same permissions. Cancel the other six subscriptions.
The stack you are already paying for.
Six subscriptions is a conservative desk. Each one is billed per seat, renewed separately, administered separately — and not one of them knows what a ticker is. That is $996 a person a year spent on software that cannot tell you when the company reports.
- Six renewal dates, six admin consoles, six onboarding steps per hire.
- The research lives in one tool, the decision in another, the evidence in a third.
- None of it is reachable from a screener, a portfolio or an agent.
Public and private channels, direct and group messages, threaded replies, @mentions, reactions and search — running next to the charts rather than in another window.
Per-team pages in folders, with cross-team shares and protected pages. The desk handbook, the runbook and the process note, written where the desk already is.
Workspace › Space › Project › Issue, with boards, backlogs, sprints, epics, components and story points. Real issue keys — RES-14, not ticket #382.
One desk calendar with recurrence and busy-only privacy — and an event can carry a ticker, so it links straight through to the company page.
Publish availability, let a client pick a slot, pull busy time from the calendar you already keep. The demo button at the top of this page is running on it.
Accounts, contacts, interactions, tasks and pipeline for institutional coverage — and an account links to its institutional filer record, so the firm in your pipeline is a researchable entity.
Personal and desk to-dos sharing one engine with Projects, so a loose item can be filed into a real project later without being retyped.
Research notes kept in the platform that produced the numbers, instead of a document you have to re-verify every time you open it.
A full drawing canvas with click-by-click reveals. Build the morning deck without exporting anything into another application first.
Collaborative grids whose cells update live. The shared sheet stops being stale the moment somebody else opens it.
Shareable symbol grids with grouping, subtotals and weights — a saved object, not an export that ages the second it lands in the folder.
One membership list that is also the access-control list for every shared watchlist, portfolio, screen, wiki page and project.
The office tools are wired into the market data.
Anyone can sell you a chat app and a wiki in one invoice. The reason to run yours here is that they sit on the same stack as the analytics engine — so the thing you are talking about is a symbol the platform can already price, chart, screen and backtest.
A team-calendar event can carry a symbol, so the board meeting, the site visit and the earnings date sit on one grid — each one a click from the company page.
A CRM account links to its institutional filer record, so the firm in your pipeline is the same entity you can pull up, screen and chart.
Your team is the access-control list for watchlists, portfolios, screens, custom series, wiki pages and projects at once. Nobody is onboarded six times.
A question in chat becomes a to-do, a to-do becomes a filed issue with a real key — without leaving the screen that raised it, and without a second login.
The workspace sits on the same stack as the analytics engine, so an agent that can run a screen can also open the issue and write the note about it.
Every tool above is included in the one subscription — no per-seat add-on, no separate workspace bill, no connector to maintain. Mentions, share activity, agent results and operator alerts all land in one notification centre in the header.
Start free.
Free
no credit card — open in a minute
- Live quotes
- World markets, the news wire and calendars
- Real data, not a sandbox or a sample set
- No card, no trial clock — the free tier just stays free
Terminal
per seat, per month — or $1,990 a year, two months free
- Live quotes, world markets, news and calendars
- All 185 apps, no feature gates
- CLI, REST & GraphQL API, MCP server
- AI agents, workflows, documents and skills
- 10,000 AI credits a month, per seat
- Unlimited watchlists, portfolios and teams
- The whole workspace suite — chat, wiki, projects, calendar, CRM
Straight answers.
Can I try it without paying?
You can look around without an account at all — quotes, company screens, charts, world markets and the news wire open straight from the browser. Create a free account, no credit card, to keep watchlists and settings. Terminal unlocks the rest of the engine: screening, backtesting, the full options surface, the CLI, the API and the AI agents.
What does it cost?
One plan, $199 per seat per month, or $1,990 per seat per year — two months free. Every app, the CLI, the API, MCP access and the agents are included: there is no feature ladder to climb and no tier that unlocks the part you actually wanted. Add or remove seats as the desk changes and the invoice follows; you are billed for the people who actually have logins.
How does that compare with a traditional terminal?
A seat on the incumbent terminal is roughly $30,000 a year, which is why most desks buy a handful and share them. A seat here is $199 a month — so you put the whole team on it. The junior analyst, the risk person and the PM each get their own login instead of queueing for someone else's.
What markets do you cover?
One universe of 86,000+ instruments: global equities, ETFs, mutual and closed-end funds, REITs and MLPs, options, indices, currencies, commodities, crypto, economic series and market internals — all normalised into the same symbol model with adjusted history.
Do I have to use the command line?
No. The CLI, the API and the agent are additional doors into the same engine — the browser terminal is a complete product on its own. The point is that nothing is exclusive to the interface.
How is the AI different from a chatbot on top of documents?
Ours calls the analytics engine as tools. When you ask for an average earnings move it runs the calculation over raw price history and shows you the commands it used. Document retrieval is one feature of the stack, not the whole of it.
Do we still need Slack, Confluence and Jira?
No. Team chat, a team wiki, a Jira-style project tracker, a shared calendar, a meeting scheduler, a coverage CRM, to-dos, notes, presentations and collaborative live tables are all built into the platform and included in the same subscription. A conservative version of that stack bought separately is around $83 per person per month, or $996 a year — and none of those tools can price a symbol. Ours run on the same stack as the analytics engine, so a calendar event can carry a ticker and a CRM account links to its institutional filer record.
Can my own agent connect to it?
Yes — we run an MCP server listed in Anthropic's directory, so Claude or any MCP-capable agent can load the full command catalogue as native tools. There is also a REST and GraphQL API for everything else.
Ask the market a question. Get a calculated answer.
The AI is not a chatbot bolted onto a document store. It calls the same analytics engine that powers every screen on this platform — so what comes back is a number it computed from raw history, with the command that produced it.
86,000+ instruments
Global equities, ETFs, funds, options, FX, commodities, crypto, economics, filings, transcripts and news — one normalised symbol universe with adjusted history.
A real analytics engine
Screening, backtesting, technicals, options analytics, correlations, seasonality and factor models — computed on demand from raw prices, never a stale cache.
It shows its working
Answers arrive with the charts, tables and tool calls behind them, so you can check the number instead of trusting a paraphrase.
Your own documents
Upload filings, decks and research. Ask across them and the answer cites the page it came from.
Agents and workflows
Multi-step research that runs the platform's tools for you — screen, pull the history, compute, compare, then write it up.
MCP, CLI and API
The same command catalogue from Claude, your own agent, a shell or your pipeline. The answer on screen is the answer your job gets at 4am.
You ask
“How does NVDA usually trade through earnings?”
It calls
→ ka.options_expected_move(NVDA)
It answers
NVDA has averaged a 9.2% absolute move on the day after earnings and closed higher 67% of the time. Two in three reactions land between −4.2% and +16.3% — the distribution is skewed right, not symmetric.
Every figure computed live from our own history — not scraped, not summarised.
Or start with