What's New
Product updates, improvements and fixes across the KlickAnalytics platform.
Explore price recovery patterns
We've added additional stats in our symbol performance recovery app. Now our users can view not only how quickly an instrument recovers from price movements, but also be able to view;
- Maximum/Minimum Positive and Negative returns
- # of Positive/Negative occurrences and more.
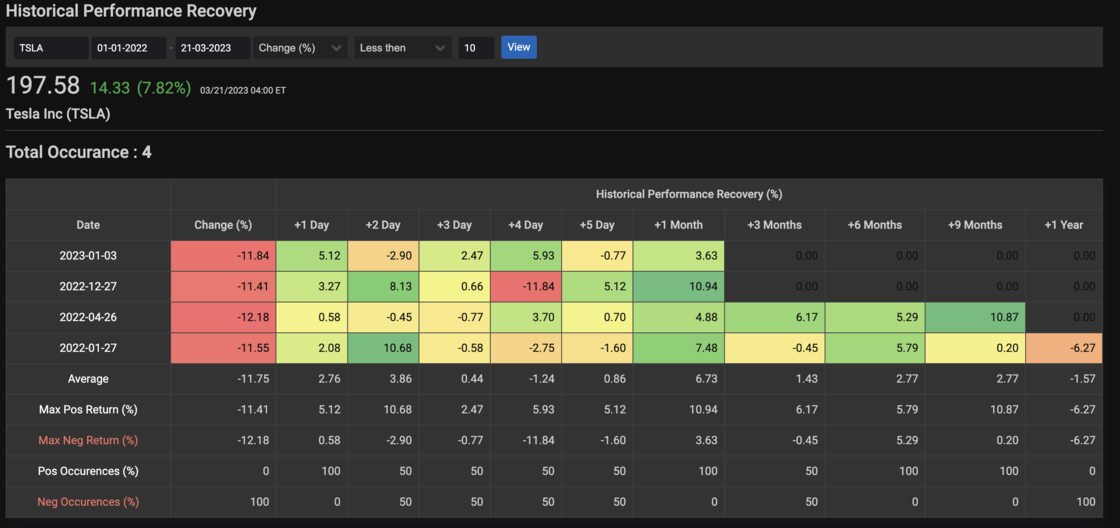
To access: Search for any global symbol say TSLA, and then from top symbol menu, select Analysis > Recovery
Explore more collections e.g. ChatGPT, NFT stocks...
We've added the following new collections e.g. ChatGPT, NFT stocks and more.
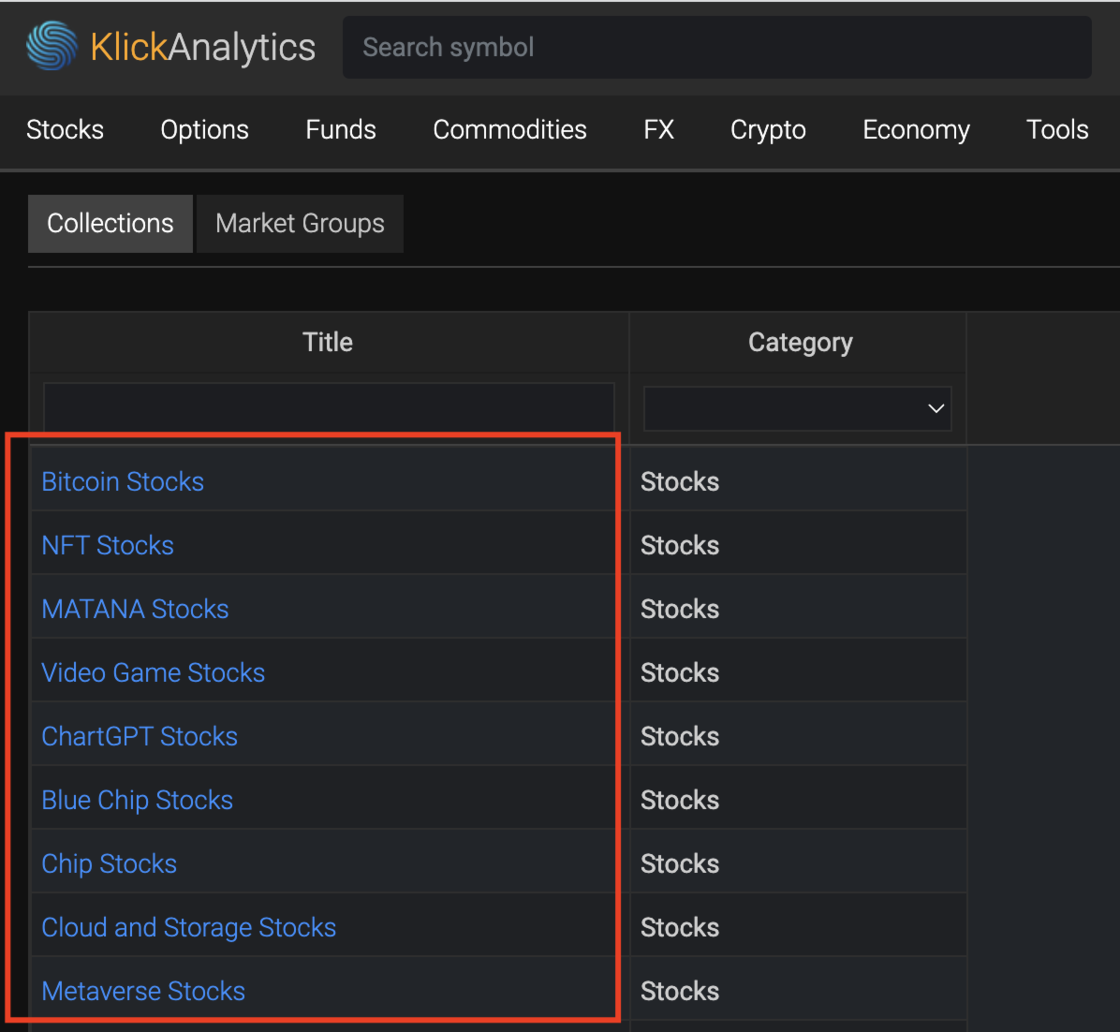
Our users can access the above collections, and analyze these instruments side by side with more visualization and more.
To access: Click on top menu > Stocks > Collections
View historical correlations by week, months...
Run historical correlations among any global instrument, and even filter data by daily, weekly timeframes, or data items like OHLCV and more at KlickAnalytics.com
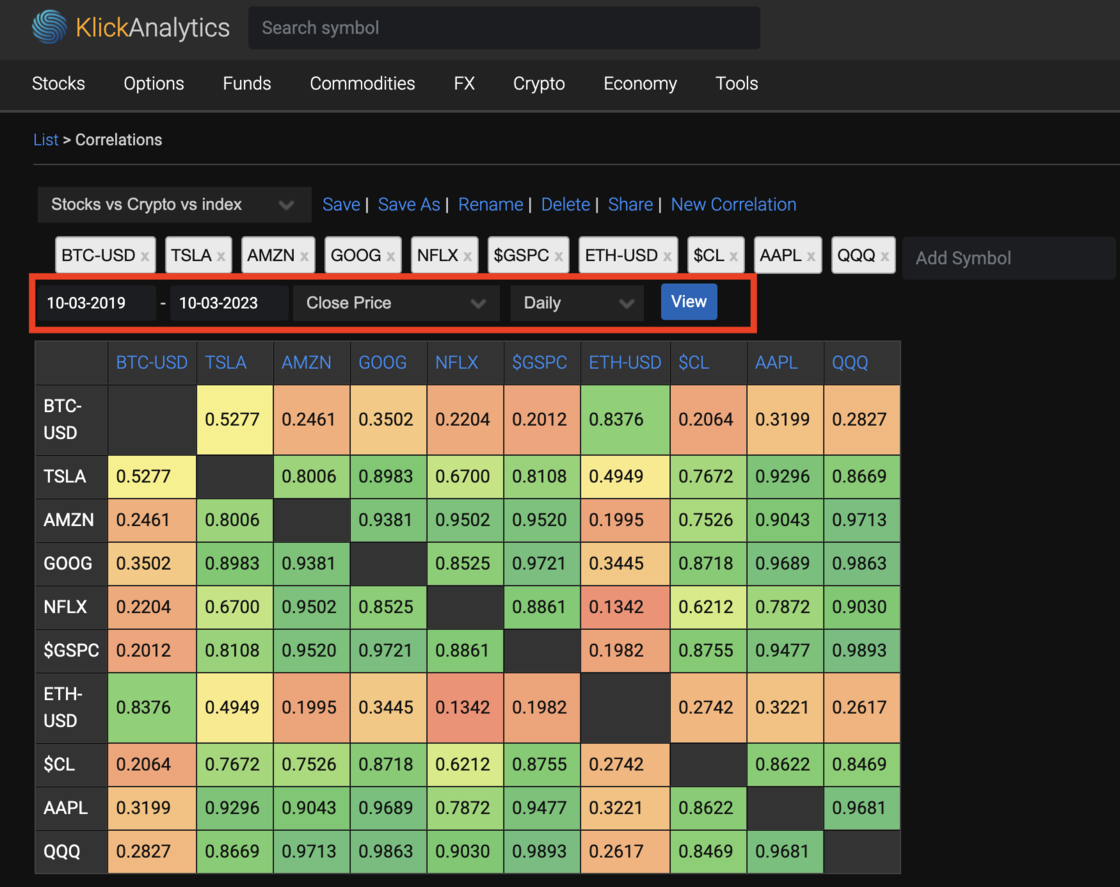
To access: From the top menu, select Tools > Correlations
View all 'confirmed earnings'
We've added a new app where you can view all the 'confirmed earnings' by all companies.
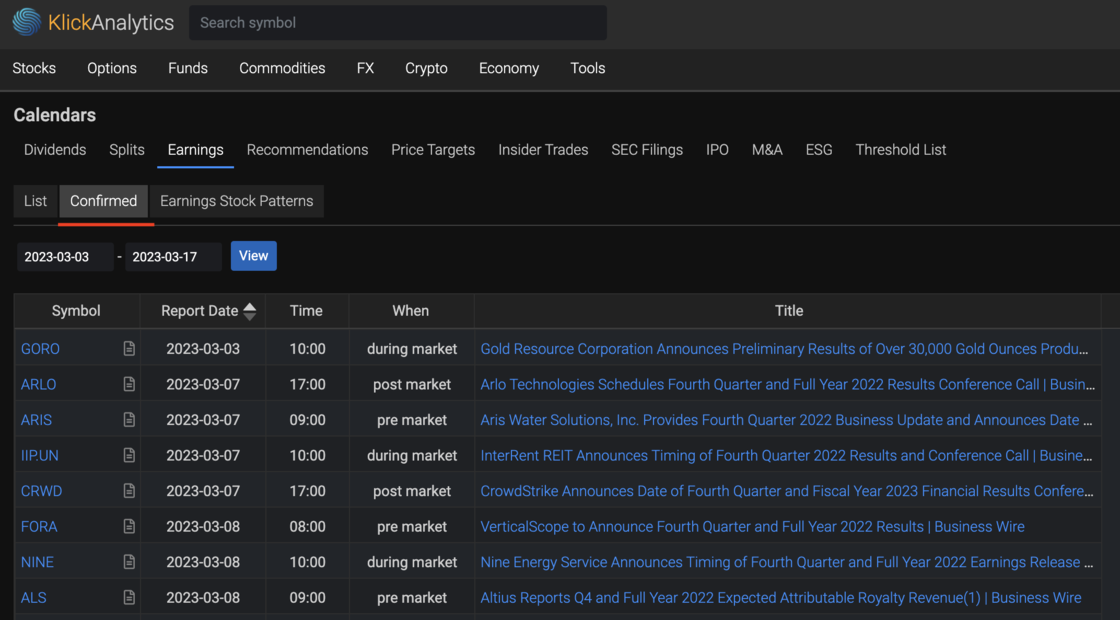
To access: From the top menu, select Stocks > Calendar > Earnings > Confirmed
Run correlations with OHLCV data and more
We've enhanced our 'Correlation' app to allow users to;
- run correlations using open/high/low/close/volume, 1-day change($), or 1-day change(%) among global symbols
- user can also select the frequency of the data i.e. Daily, Weekly, Quarterly or even Yearly
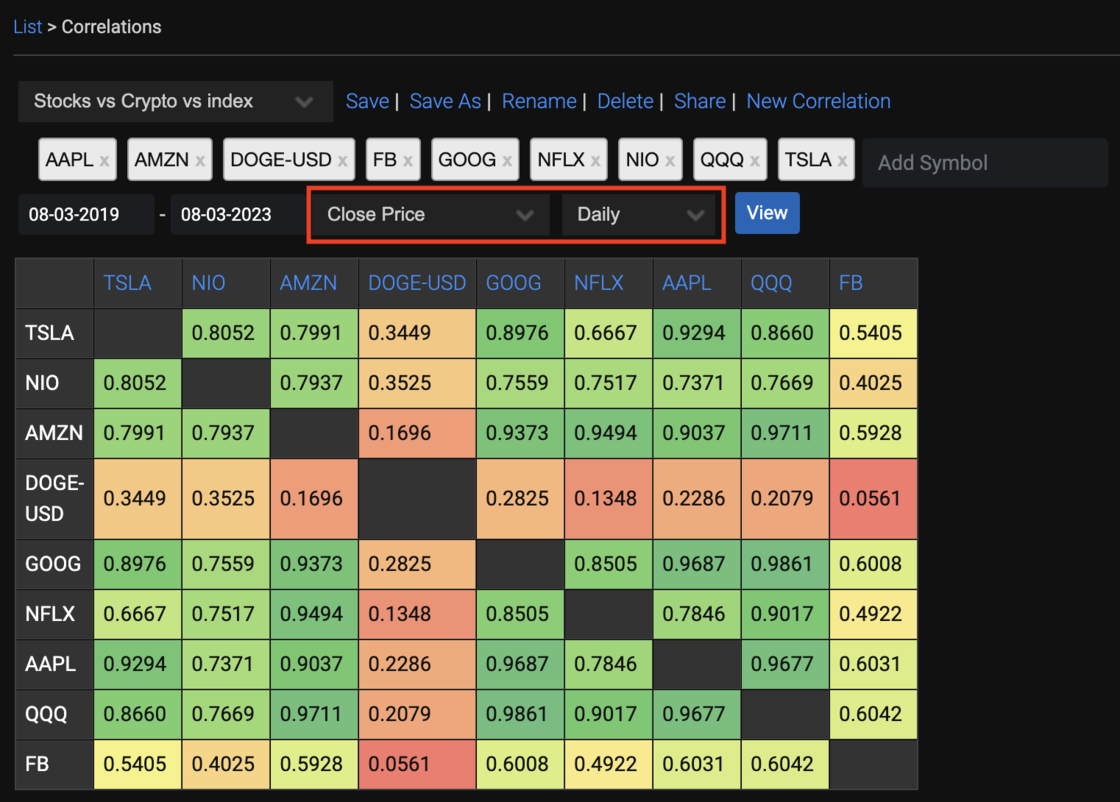
To access: From the top menu, click on Tools > Correlations
Access key company financial scores
In our fundamental data coverage, we've enhanced our 'Fundamental' app to also display the following new financial scoring numbers along with key indicators i.e.
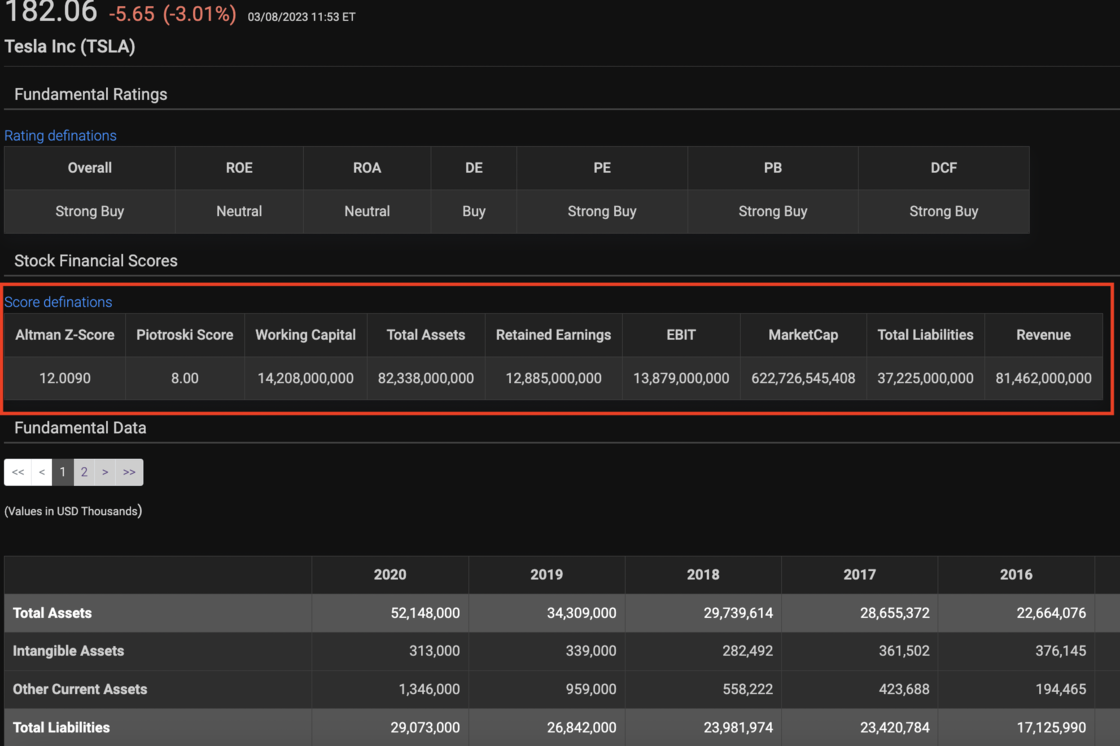
To access: Search for any global symbol say TSLA, then from the symbol menu, select Financials > Fundamentals
View company notes due!
We've added a new coverage for providing information on a 'Company Notes Due' at KlickAnalytics.com
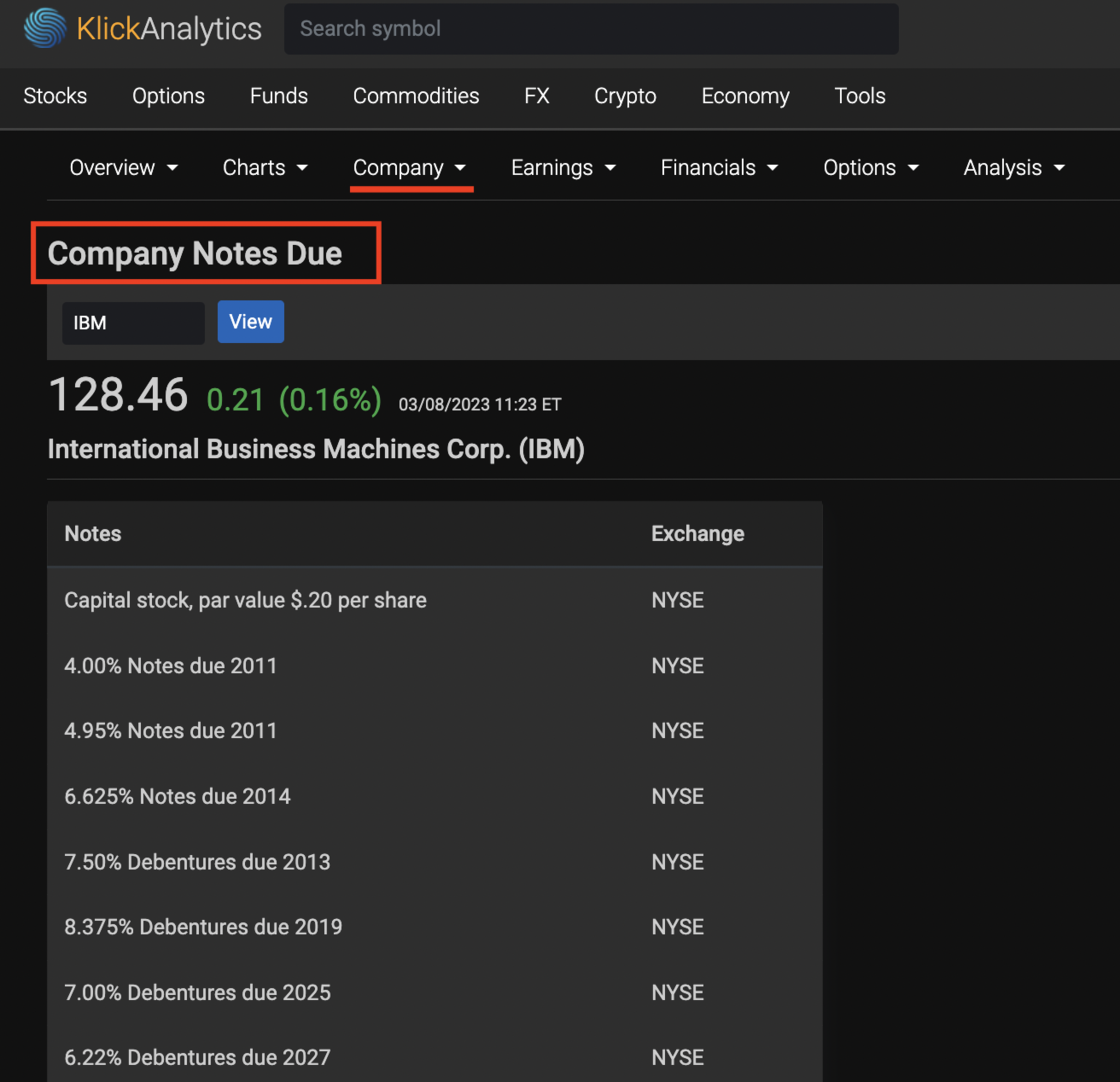
To access: Search any listed company say IBM, then from the symbol menu, select company > Notes Due
View volume bands, min/max/averages and more...
We've enhanced our 'Unusual Volume' app to now include the following;
- User can view historical volume statistics
- The stats are displayed by Years and Month basis
- Stats includes, average price, min/max/average volume, standard deviations
- Volume bands to showcase values for 25%, 50% and 75% percentile of the volume distribution
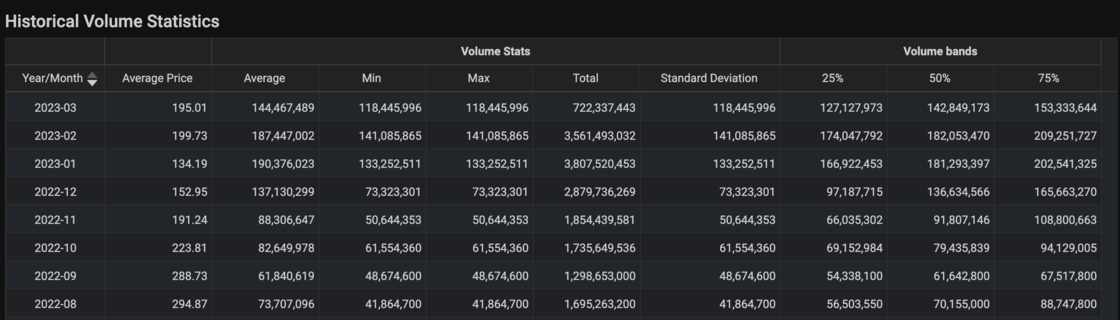
To access: Search for any global symbols say TSLA. From the symbol menu, select Analysis > Unusual Volume
View normalized sector performances
We've enhanced our sector performance application, where our users can view historical normalized sector performances for all major US sectors.
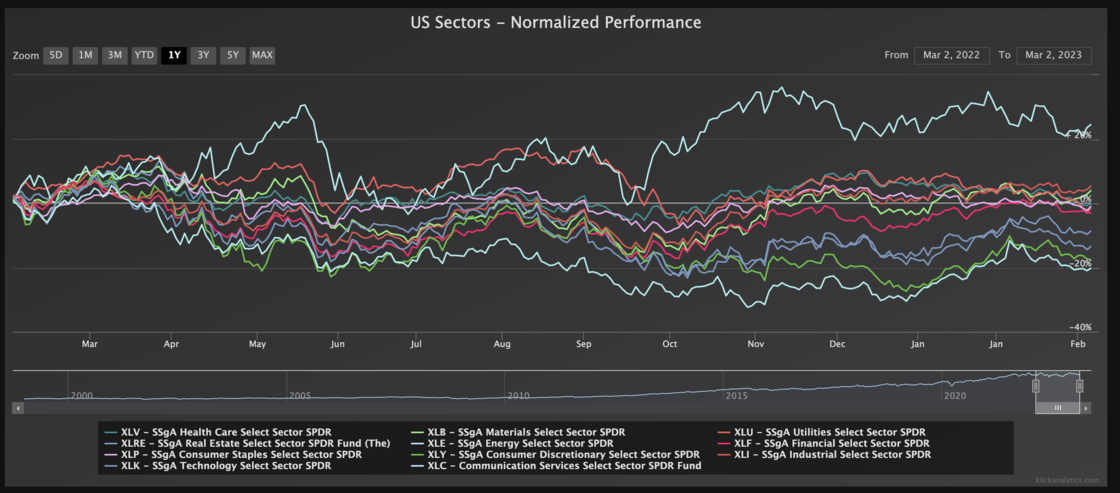
This will allow our users to quickly compare sectors together, and also how different sectors are trending across time as well.
To view: From the top menu, click on Stocks > Indices > Sectors
View historical volatility trends by month/year
We have enhanced our volatility application which now display;
- Historical volatility by months/years
- Provide full summary based on average, positive/negative returns by each month and dates
- Min/Max and average values by each year
The above will help our users to view the volatility trends across a time period for trade opportunities and more.
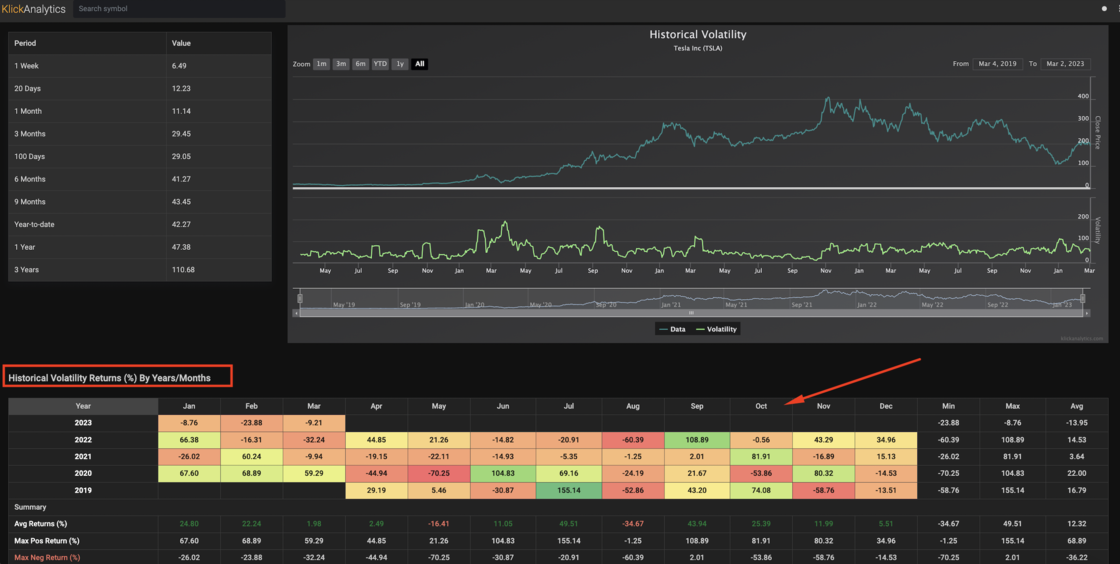
To view: Search for any global symbol, and then from the symbol drop down menu select Analytics > Volatility