What's New
Product updates, improvements and fixes across the KlickAnalytics platform.
58 updates · clear
The Global Symbol Search...
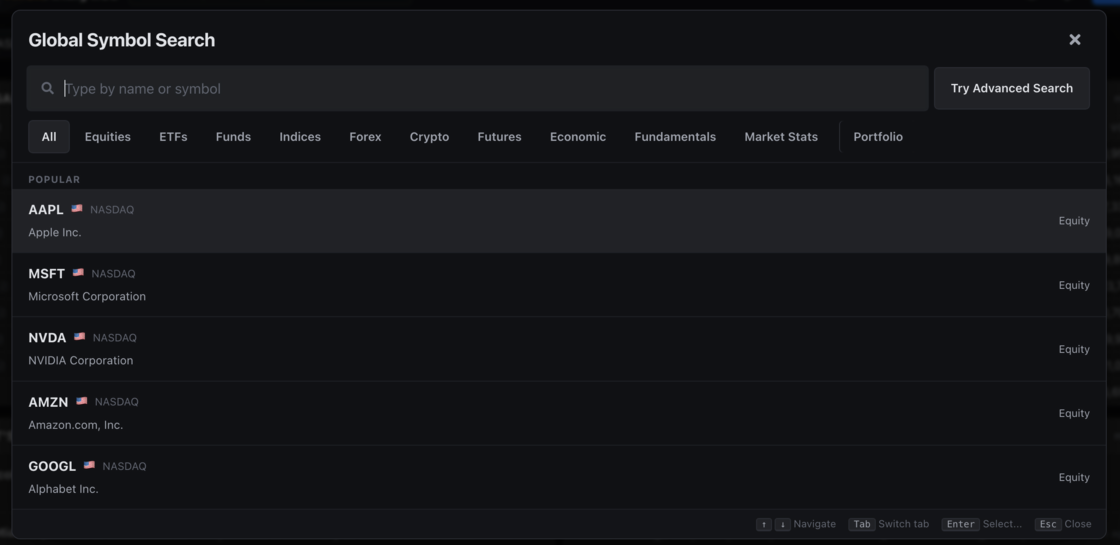
The new Global Symbol Search makes it faster to find and access instruments across the entire KlickAnalytics platform.
Search by symbol or company name, browse by asset class, and quickly jump into equities, ETFs, funds, indices, forex, crypto, futures, economic data, fundamentals, market stats, and portfolio tools—all from one unified search experience.
With popular results, tab-based filtering, and an optional Advanced Search, users can discover the exact symbol or dataset they need in seconds, making navigation across global markets much more efficient.
A Faster Way to Access Everything in KlickAnalytics
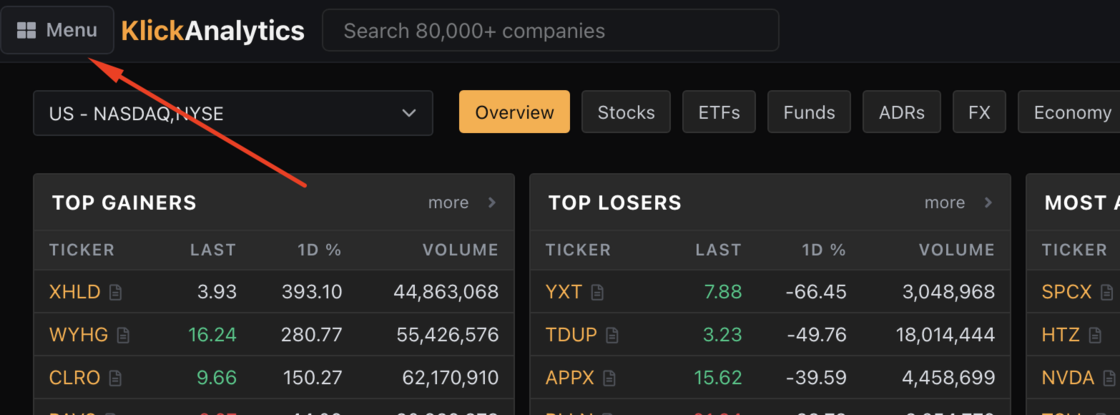
The new KlickAnalytics Menu gives users one central place to discover and open every application across the platform. Browse tools by category, instantly search through more than 130 apps, switch between different viewing layouts, and mark frequently used applications as favorites for faster access.
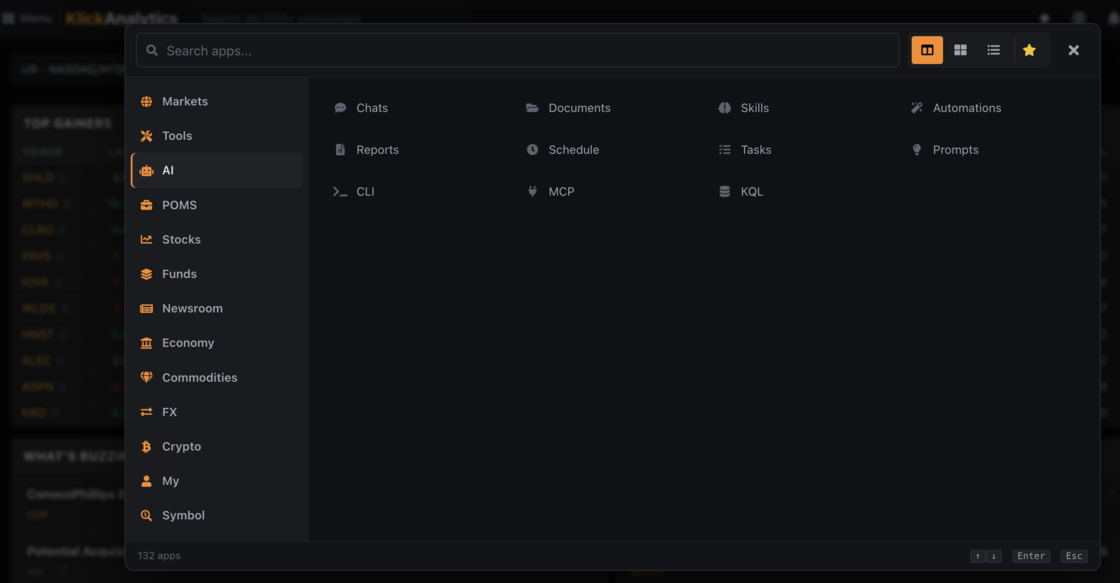
Whether you need markets, stocks, AI, reports, documents, automations, portfolios, economic data, crypto, or symbol-level analytics, everything is now easier to find—without navigating through multiple pages.
Our Portfolio tool will tell you a story...
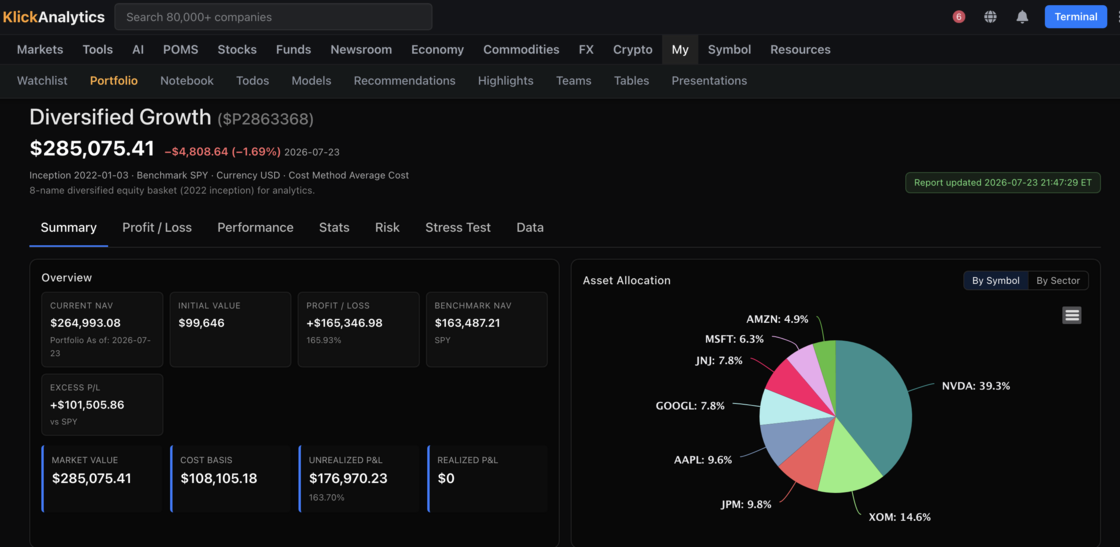
We didn't build a portfolio tracker. We built a portfolio analyst that never sleeps.
Most "portfolio dashboards" show you a number that goes up and down. Ours tells you why — and whether you actually earned it.
We just shipped a full institutional-grade portfolio suite inside KlickAnalytics 🚀 — and here's what's under the hood:
📊 Every portfolio becomes a ticker. Your holdings compound into a private performance series ($P…) you can chart, compare, and benchmark like any stock — with a proper Time-Weighted Return engine that strips out your deposits and withdrawals. No more "I added $10k and it looks like I'm up 90%." Real performance, not cash-flow illusions.
💹 Profit/Loss that reads your transactions. Net positions built straight from your trades, with expandable FIFO lots, grouping by sector / industry / country / account, weighted-average summary rows, dividend income (LTM) + yield, and a frozen-column grid you can slice like a pro terminal.
📈 Performance, the way analysts actually look at it. Total-return vs benchmark, rolling beta / volatility / Sharpe / Sortino, periodic + annual returns, upside/downside capture, worst-5 drawdowns, underwater plots, and return-quantile boxplots.
🧮 60+ risk & return metrics — Sharpe, Sortino, Calmar, Omega, Smart Sharpe, Probabilistic Sharpe, Serenity, VaR/CVaR, tail ratio, Kelly, and more — with a configurable risk-free rate and a Monte-Carlo projection of where you might land.
🌍 Stress-test against history. Drop your portfolio into the 2022 inflation shock, COVID, the GFC, the 2025 tariff turmoil — or any window you define — and see how it would've held up vs any symbol you choose.
🔎 A full Data tab — every level, return, and drawdown point, charted + tabled, comparable, and exportable.
All of it benchmark-aware, mobile-ready, private by default, and shareable with your team.
The punchline: Your broker shows you a balance. We show you a thesis. 🎯
If your portfolio can't tell you its Sortino, its capture ratio, and how it survives a 2008 — it's not a portfolio, it's a guess.
To access: From the menu, click on My > Portfolios
Track Every High, for any Global Symbol...
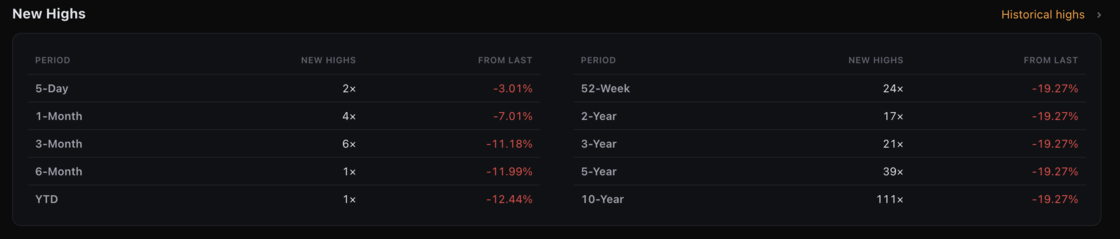
KlickAnalytics now gives you a complete New Highs overview for any global symbol.
See how often a stock, ETF, index, commodity, currency, or other market instrument has reached a new high across multiple periods—including 5-day, 1-month, 3-month, 6-month, YTD, 52-week, 2-year, 5-year, 10-year, and historical highs.
You can also instantly see how far the symbol is currently trading from its latest high, helping you identify momentum leaders, potential breakouts, and instruments that have pulled back from previous peaks—all in one clean, easy-to-read view.
To view: Search for any symbol say AMZN, and then click on Overview > Quotes
Reimagined Earning Calendar
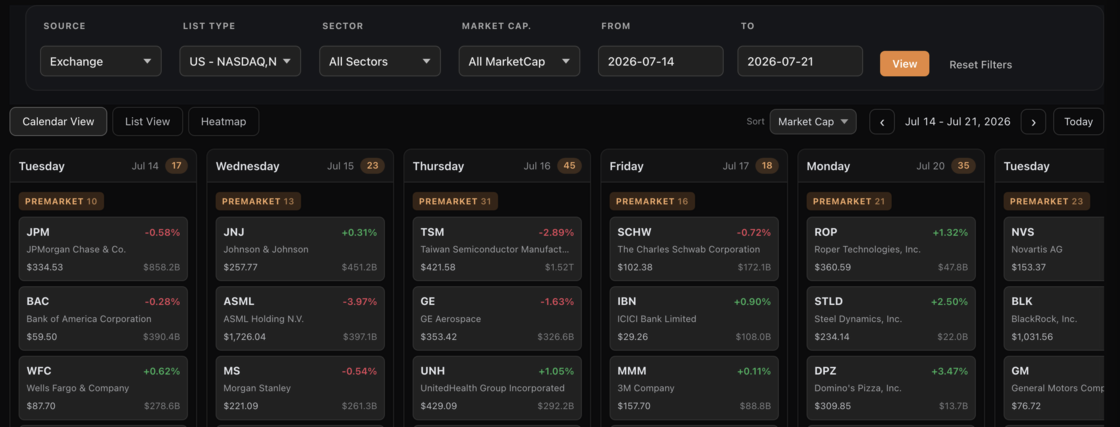
📊 New on KlickAnalytics: a completely reimagined Earnings Calendar
Knowing who reports when shouldn't take more than a glance. So we rebuilt our Earnings Calendar from the ground up — faster, smarter, and built for how traders actually work.
Here's what's new:
🗓️ Three ways to view earnings
- Calendar view — companies laid out day by day, grouped by Premarket / After Hours, sorted by market cap, % change, or volume
- List view — a fully filterable data grid
- Heatmap — an 8-week outlook that shows exactly where earnings season heats up
🎯 Filter to what matters to you
Slice the calendar by Exchange, Index, Market Groups, Collections — or your own Watchlist. Layer in Sector, Market Cap, and a custom date range to get precisely the names you care about.
🔍 Zoom into any stock
Click any company to open an instant snapshot — live quote, day / week / month / year performance, market cap, and a historical EPS chart showing beats vs. misses at a glance. Flip through companies without ever leaving the view.
⚡ Quick, clean, and fast
Jump week to week, hide the noise (parent tickers only), and get a clear read on the week ahead in seconds.
Earnings season just got a whole lot easier to navigate.
👉 To view: Click on Stocks > Earnings
Excel-Style Formula Scanner
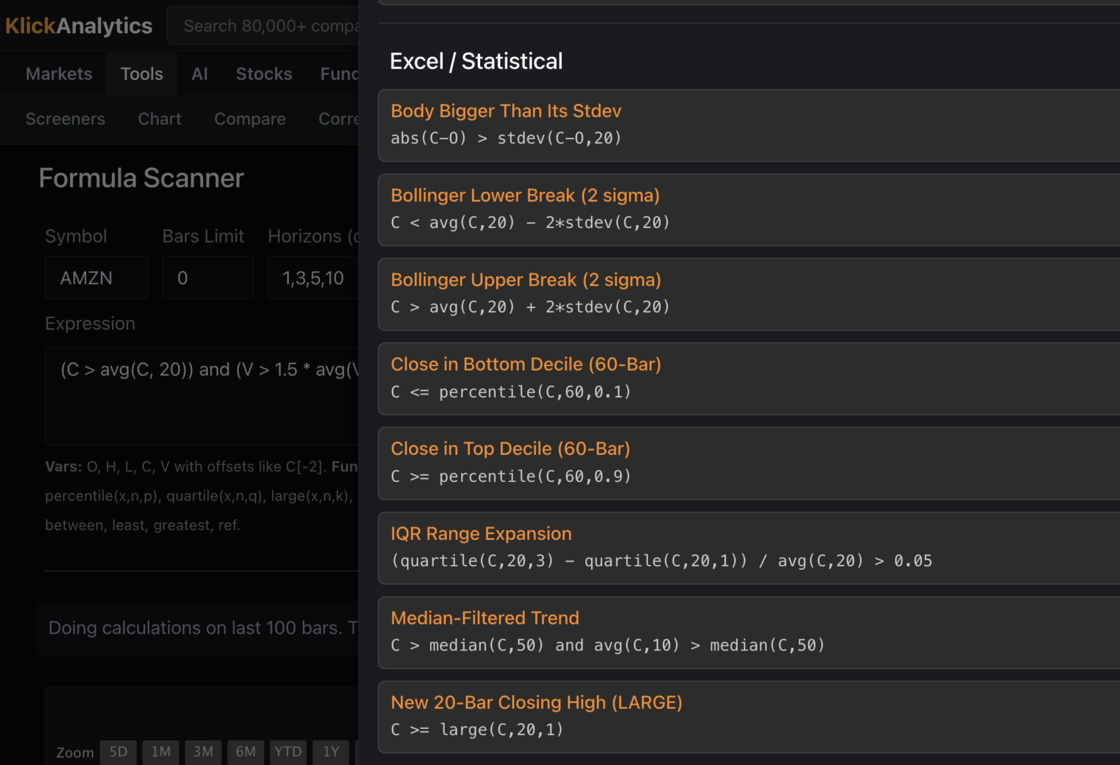
KlickAnalytics Formula Scanner now supports Excel / statistical-style formulas — making it easier to scan markets using logic traders already understand.
Build formulas like:
C > avg(C,20) + 2*stdev(C,20)
or scan for things like:
Bollinger breaks, percentile moves, median trends, IQR expansion, volume spikes, and custom statistical conditions.
No complex scripting. No hard-coded screeners. Just write the formula, run the scan, and find the setups that matter.
To access: From the top menu, Click Tools > Formula Scanner
AI Chat Just Got Visual...
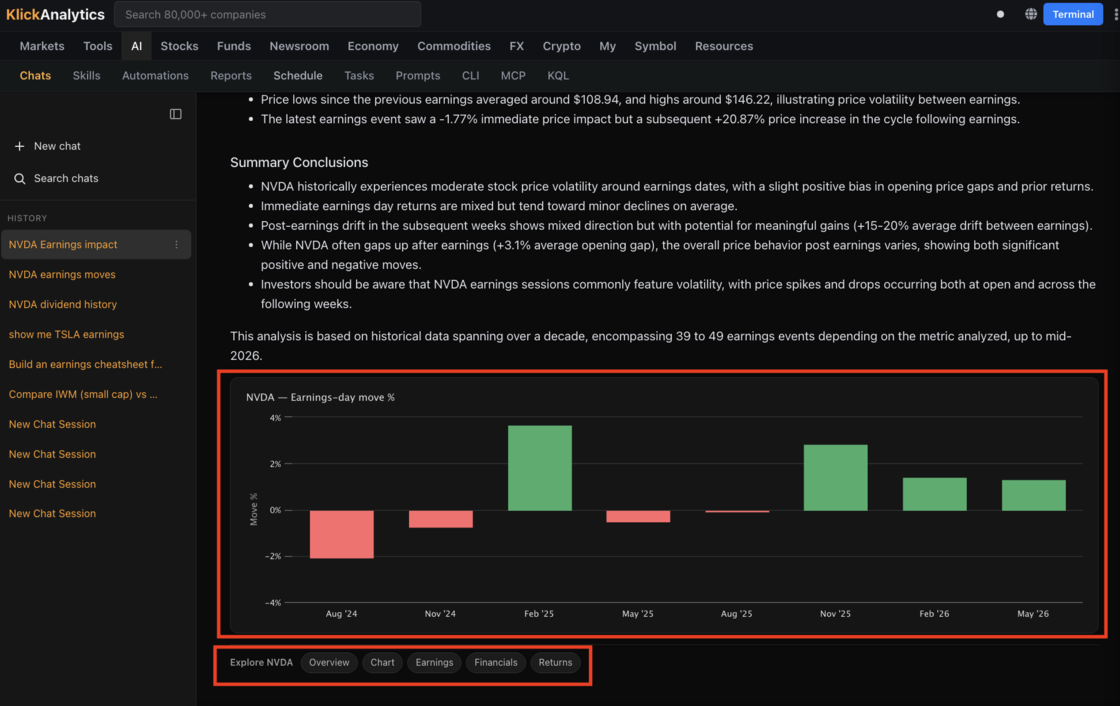
KlickAnalytics AI Chat now goes beyond answers.
It can analyze the data, explain the story, and generate visualizations directly inside the conversation — charts, tables, earnings views, returns breakdowns, and more.
- No switching tabs.
- No building charts manually.
- Just ask the question — and the AI turns the answer into something you can actually see.
From earnings impact to price moves, financials, returns, and market behavior, KlickAnalytics Chat is becoming a true research workspace.
Ask. Analyze. Visualize. Explore.
To View: From the top menu, Click on AI > Chats > and start a new chat, and in chat input box, type "Show me how NVDA perform during its earning sessions"
Formula Scanner just got more smarter...
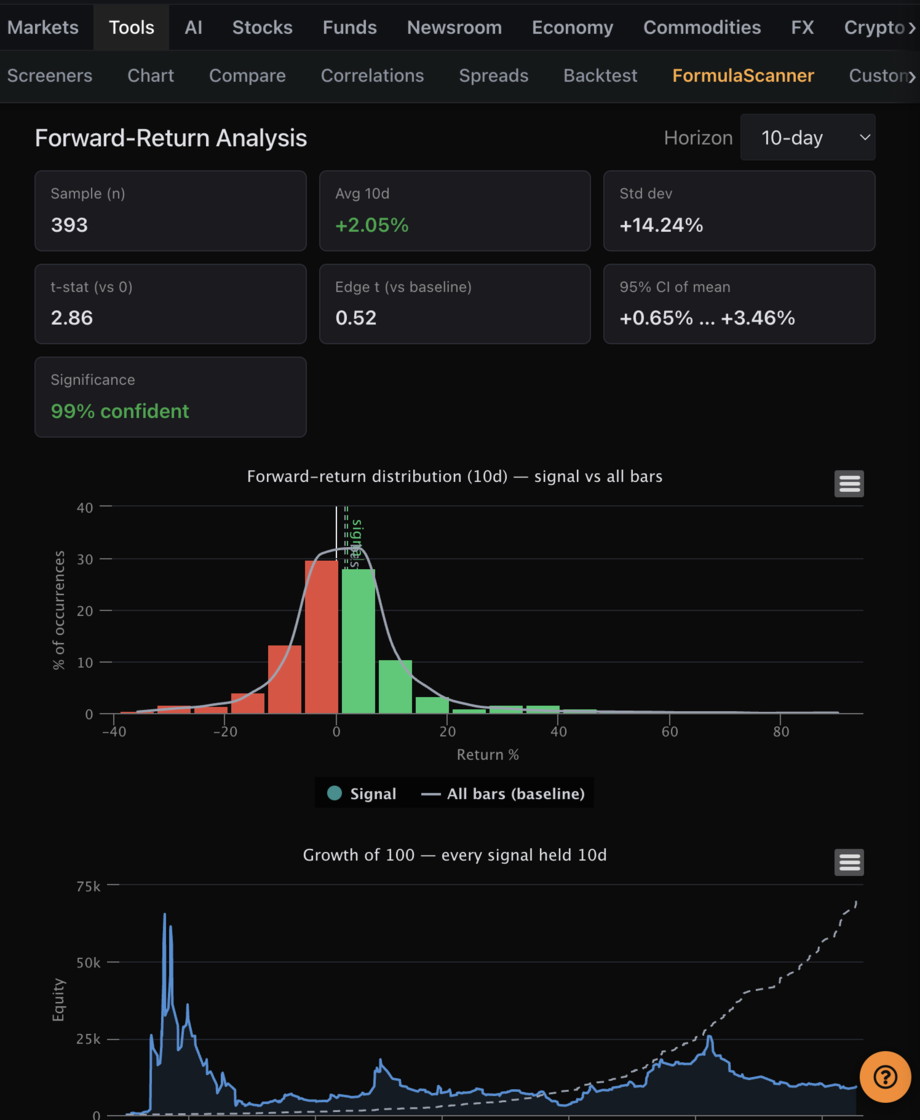
We've added a new analytics layer to Formula Scanner so you can tell at a glance whether a pattern actually has an edge:
- Key Observations — a plain-English read of every scan: how often your formula fires, its win rate, and whether it beats buy-&-hold.
- Edge vs. baseline — every signal is now measured against the stock's normal forward return, so you see the real edge, not just the average.
- Forward-Return Analysis — a return-distribution histogram and a "growth of 100" equity curve, each overlaid with the baseline, plus a statistical-significance check (t-stat & confidence) to separate real signals from noise.
- Seasonality — see which months and years your signal tends to fire.
- Flip the horizon (1–10 days) to refresh every chart instantly.
To view: From Tools > Formula Scanner
🚀 New App Navigation — Everything at Your Fingertips
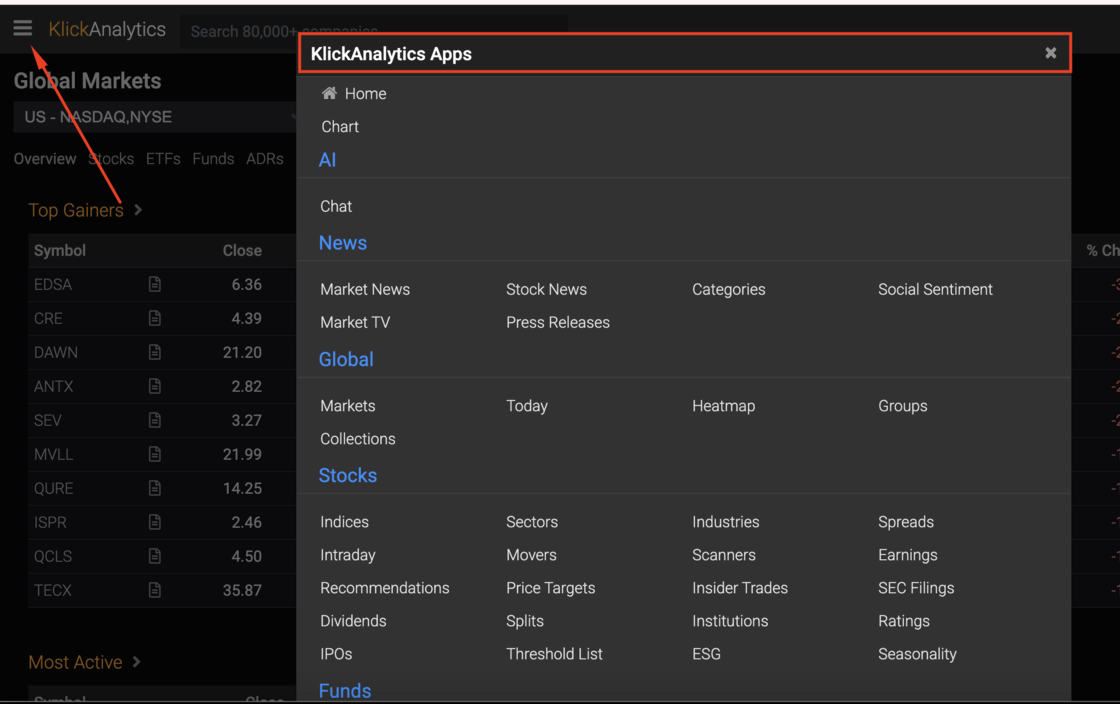
We’ve introduced a new modern navigation panel that makes it easier than ever to explore KlickAnalytics. Instantly access charts, AI tools, news, markets, stocks, and more — all from one sleek menu.
Just click the menu bars (☰) to open the new KlickAnalytics Apps panel. All features — from AI to market analytics tools — are now available in a clean, modern navigation designed for speed and simplicity..
Everything you need is now just one click away.
Added - Price Target Summary & Forecast
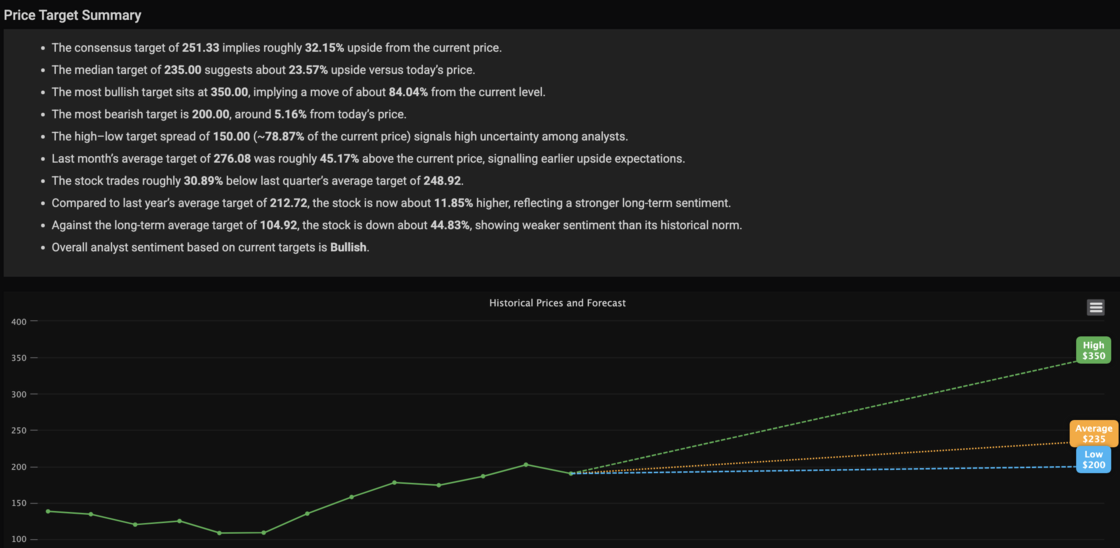
We’re excited to introduce a brand-new, powerful enhancement to your symbol research workflow — the Price Target Summary & Forecast Visualization.
This update brings analyst expectations to life with clear insights and an intuitive, interactive chart.
🔹 Smart Analyst Summary
For every symbol, you now get an instant, data-driven narrative summarizing:
Consensus, median, bullish, and bearish targets
Upside/downside percentages vs current price
Last month, last quarter, and last year target comparisons
Long-term sentiment vs historical norms
High–low target spread (market uncertainty indicator)
Overall analyst sentiment rating (Bullish / Neutral / Bearish)
All insights are computed dynamically based on the latest analyst data.
📈 Historical Prices + Forward Forecast Chart
The new chart overlays:
Historical monthly close prices
High analyst target
Average/consensus target
Low analyst target
Each forecast line includes a colored label box for quick identification (High, Average, Low).
The visual makes it effortless to understand:
How analysts see the stock moving
The range of expectations
Where the stock sits relative to its historical trend
These features will helps you:
Quickly assess analyst expectations
Spot shifts in sentiment
Compare short-term and long-term outlooks
Visualize risk/reward in one glance
Strengthen trading and investment decisions using cleaner intelligence
Whether you're researching a single stock or scanning multiple, this tool gives you an instant edge.
To access: Search for a symbol say NVDA and then go to Company > Price Target