What's New
Product updates, improvements and fixes across the KlickAnalytics platform.
118 updates · clear
View Top Analysts Price Targets!

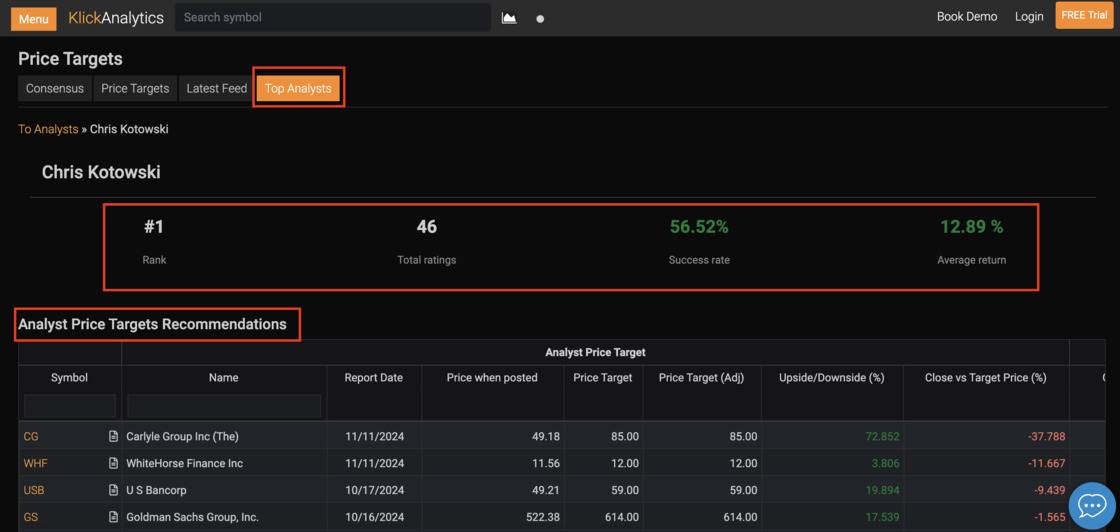
We are thrilled to announce the addition of enhanced features to Klick Analytics' Price Targets section.
Track Analyst Recommendations: Users can now view all price target recommendations made by a specific analyst, including key metrics such as price when posted, target price, adjusted target price, upside/downside percentage, and close vs. target price percentage.
Top Analysts Rankings: Easily access a detailed leaderboard of top-performing analysts, ranked by success rate, average returns, and total ratings, to identify the most reliable experts in the field. Detailed Analyst Profiles: Each analyst profile now showcases their rank, total ratings, success rate, and average return, allowing users to assess their performance at a glance.
These features are designed to provide a deeper understanding of analyst performance and empower users with actionable insights for smarter decision-making.
To access: Click Menu > Stocks > Price Targets > Top Analysts
All Press releases on your finger tips!
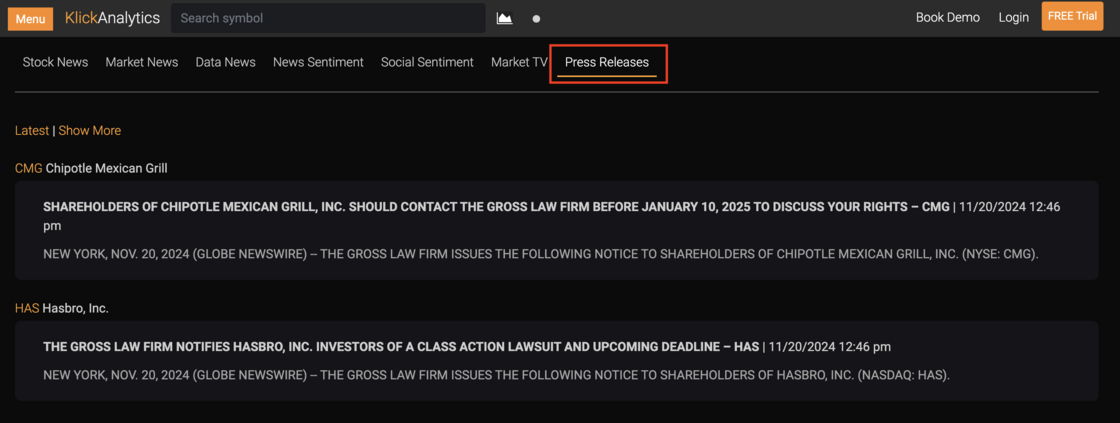
A new feature has been introduced allowing users to view both current and historical press releases. Each press release includes the company ticker, company name, a title, publication date, and a brief summary. Users can easily access all information related to specific companies directly from the interface for better insights.
Key Features:
Company Information: Displays the company ticker and name.
Detailed Press Release: Includes the title, publication date, and a brief summary of the release.
Historical Access: Users can view both current and past press releases.
Quick Navigation: Allows users to explore all related company details from the press release.
To access: Click on 'Menu' on the top, and then Click on News > Press Releases
Country ETFs added
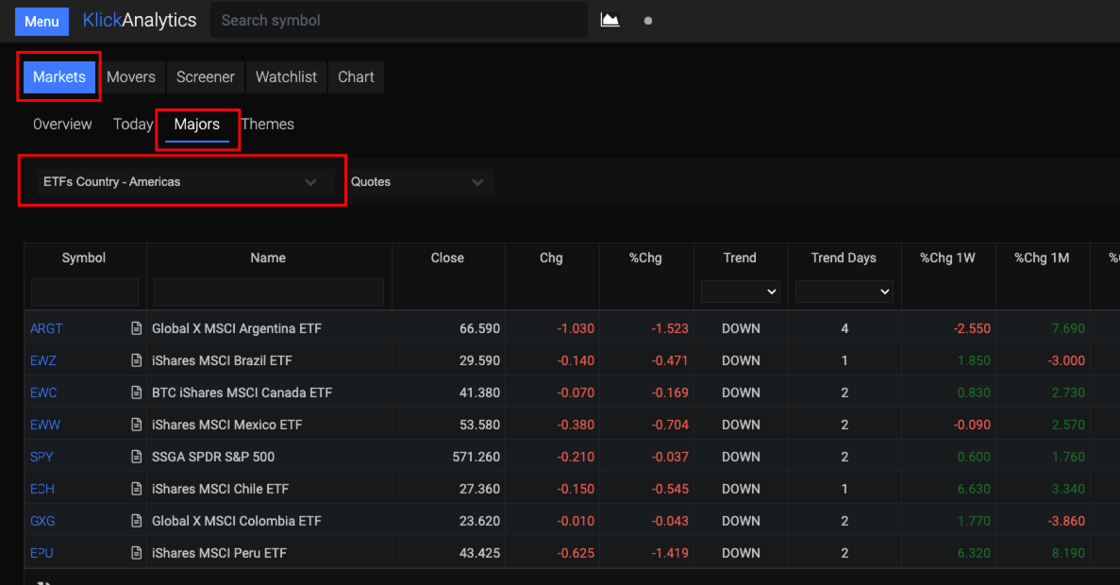
We have added the additional coverage to list all the major ETFs by country i.e.
- Americas
- Europe
- Asia Pacific
- Middle East / Africa
This will allow the users to quickly view the current and historical performances for all country based ETFs and more.
To access: From the top, click 'Menu' > Markets > Majors > and select ETFs Country like America
Intraday Returns Analysis
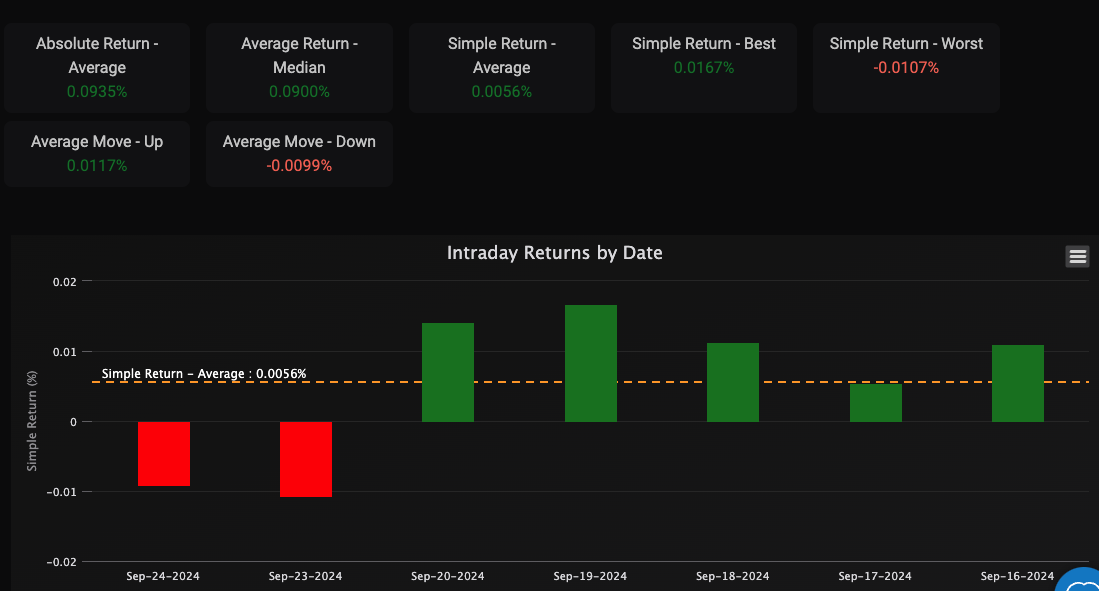
We are thrilled to announce a new enhancement to the Intraday Returns Analysis tool that brings even more precision to your trading insights. You can now explore intraday returns across a custom date range, enabling you to tailor the analysis to specific periods and events. With this update, you can dive deeper into your data by zooming in on key dates and trends. The simple return metrics, including the average, best, and worst returns, are now more interactive, allowing for a visual breakdown of returns on a daily or even intraday level. This feature also includes enhanced average move statistics, giving you a detailed view of upward and downward market movements, empowering you with more comprehensive data to refine your trading strategies.
To access: Search for any symbol, sat TSLA, from the top menu, select Analysis > Intraday > Intraday Returns
Seasonal Trades Analysis
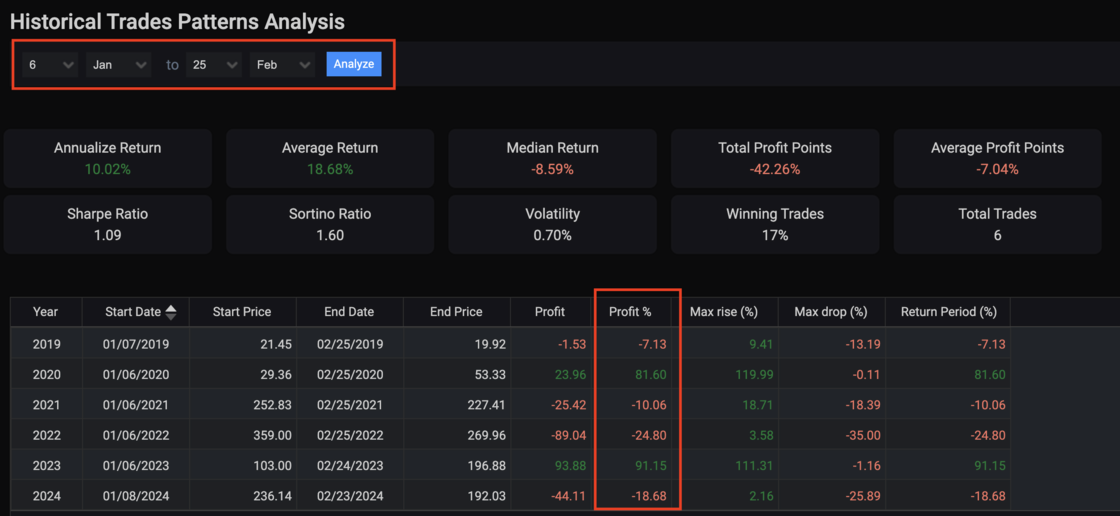
We’re excited to introduce app called Historical Trades Patterns Analysis tool, offering enhanced flexibility and deeper insights into your trading analysis.
Our users can select custom start and end days across different months and years, allowing you to explore trade patterns over any specific time period that interests you. Additionally, we’ve added the ability to filter and customize key metrics such as profit percentage, max rise/drop, Sharpe ratio, and volatility, making it easier for you to focus on the data that matters most.
Interactive charts now update in real-time as you adjust your date range or metrics, giving you a visually engaging way to spot trends and patterns instantly. A new performance summary section has also been added to quickly highlight key takeaways, providing a snapshot of your selected time frame's most critical metrics.
To view: search a symbol say TSLA, and then from the top menu, select Analysis > Seasonality > Trades
"Today" Screen: Your Global Market Snapshot at a Glance
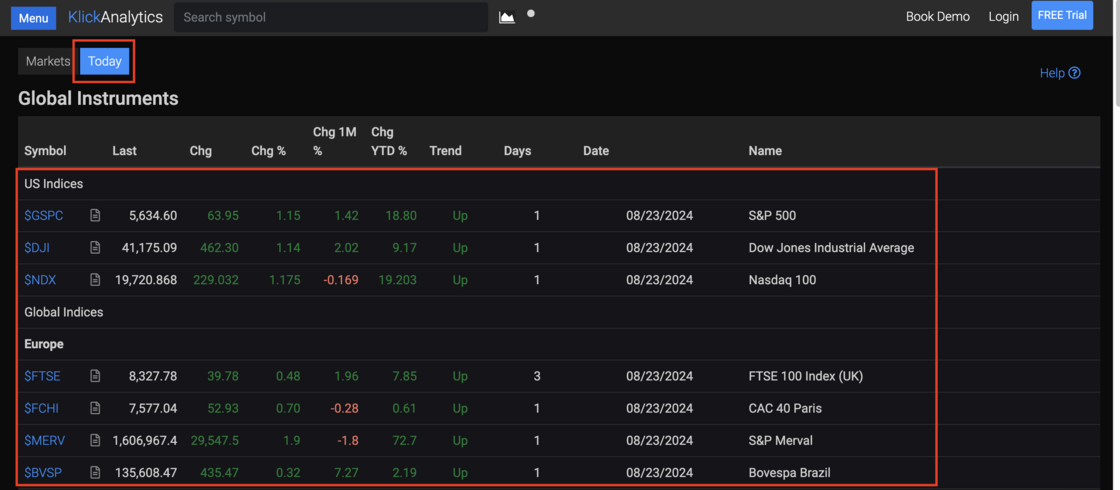
🚀 New Feature Release: "Today" Screen
We are excited to announce the launch of our new "Today" screen, now available on the main page of your home dashboard! This new feature provides a comprehensive, real-time overview of major global instruments, including indices, cryptocurrencies, currencies, major ETFs, and much more.
With the "Today" screen, you can effortlessly stay informed with a quick glance at the world's most important financial instruments, all in one place. This enhancement is designed to help you make informed decisions faster and with greater ease.
Stay ahead of the markets with our latest update!
To access: Click Menu > Home > Today
Quick Chart Access
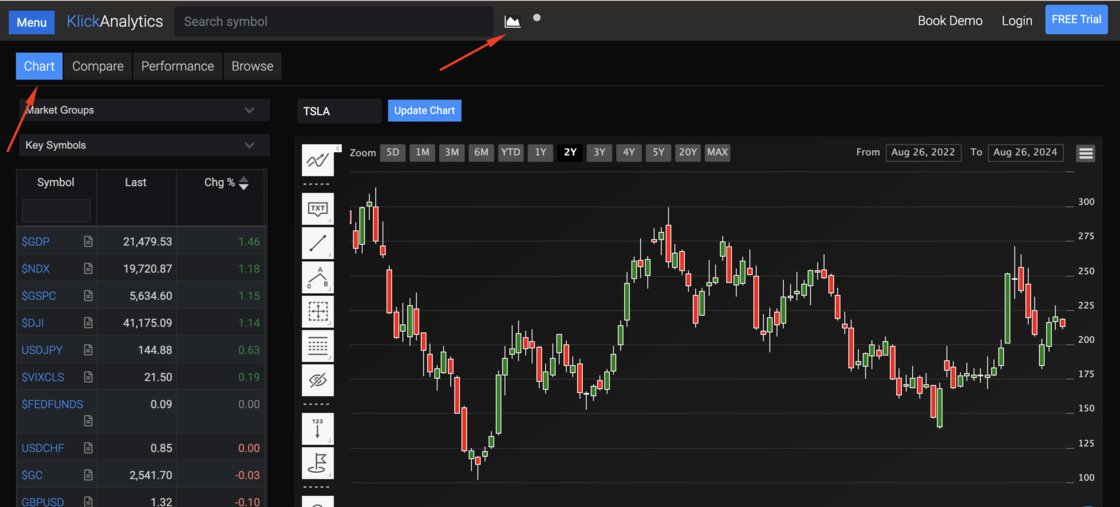
We are thrilled to introduce a powerful new feature designed to enhance your trading experience! You can now instantly access our comprehensive charting tool with just a single click of the chart icon located on the top menu. This streamlined access allows you to quickly dive into market movers, explore key instruments, or even browse through your personalized watchlist—all in one place! Whether you're analyzing trends or tracking your favorite assets, this new feature puts the tools you need right at your fingertips, making your market analysis faster and more efficient than ever before!
Explore companies financial key metrics and trends!
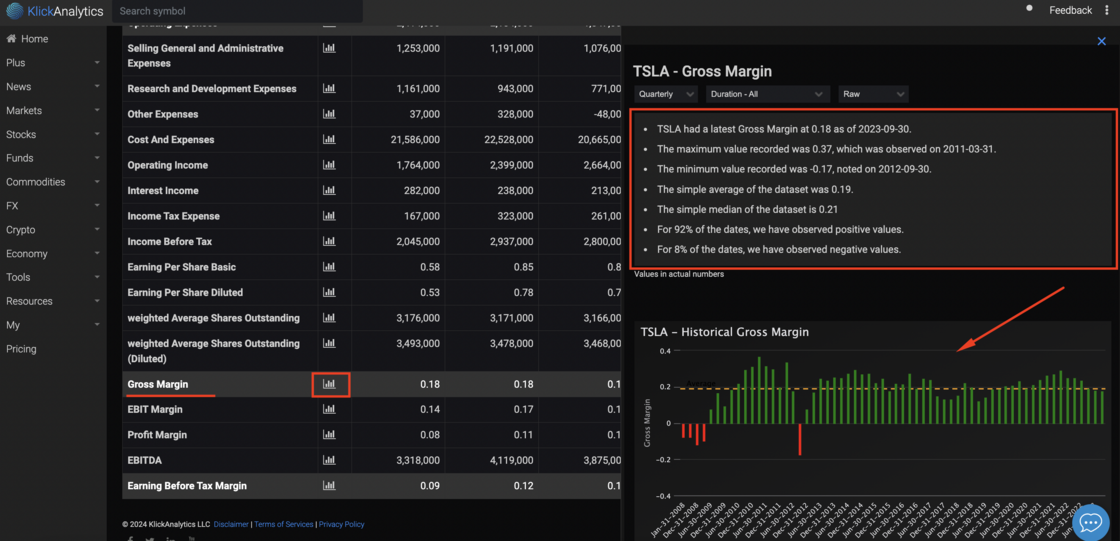
In response to user feedback and evolving industry standards, we're excited to introduce new features and enhancements to our financial statement analysis application. These updates are designed to provide users with more comprehensive insights, improved usability, and enhanced visualization capabilities.
1. Expanded Line Item Analysis:
Users can now view a wide range of financial statement line items such as gross margins, operating expenses, net income, and more. This expanded coverage allows for a deeper understanding of key financial metrics crucial for decision-making.
2. Historical Trends:
Our application now offers historical trend analysis, enabling users to track the performance of selected line items over time. From quarterly to annual views, users can identify trends, spot anomalies, and make informed projections based on past performance.
3. Flexible Observation Filters:
To cater to diverse analytical needs, users can filter observations based on customizable timeframes ranging from the last 3 months to the last 12 months or view all available data. This flexibility allows for focused analysis and quick comparisons across different periods.
4. Key Statistics:
We've introduced a new feature that provides users with key statistics for selected line items. From mean and median values to standard deviations and percentiles, users can gain deeper insights into the distribution and variability of financial data.
5. Enhanced Visualization:
A new historical bar chart visualization has been added to the application, allowing users to visualize positive and negative values over time. This dynamic visualization helps users identify trends, patterns, and outliers at a glance, enhancing the interpretability of financial data.
Conclusion:
With these updates, our financial statement analysis application empowers users to conduct comprehensive analyses, uncover valuable insights, and make well-informed decisions. We remain committed to continuously improving our platform to meet the evolving needs of our users and provide them with the tools they need to succeed in financial analysis.
To access: Search for a company say TSLA, then from the symbol menu, select Financials > Fundamentals > and then click on any of the chart icon against any line item like Gross Margin to view the analysis.
Post Earning Drift
We are very excited to showcase our new app called 'Post Earning Drift'. The app allows a users to;
- View Post Earning Price Analysis
- Showcase a visual chart on all historical earning price drifts
- The current price drift
- All the main statistics per each earning dates like Min/Max, Averages, Standard Deviations and much more.
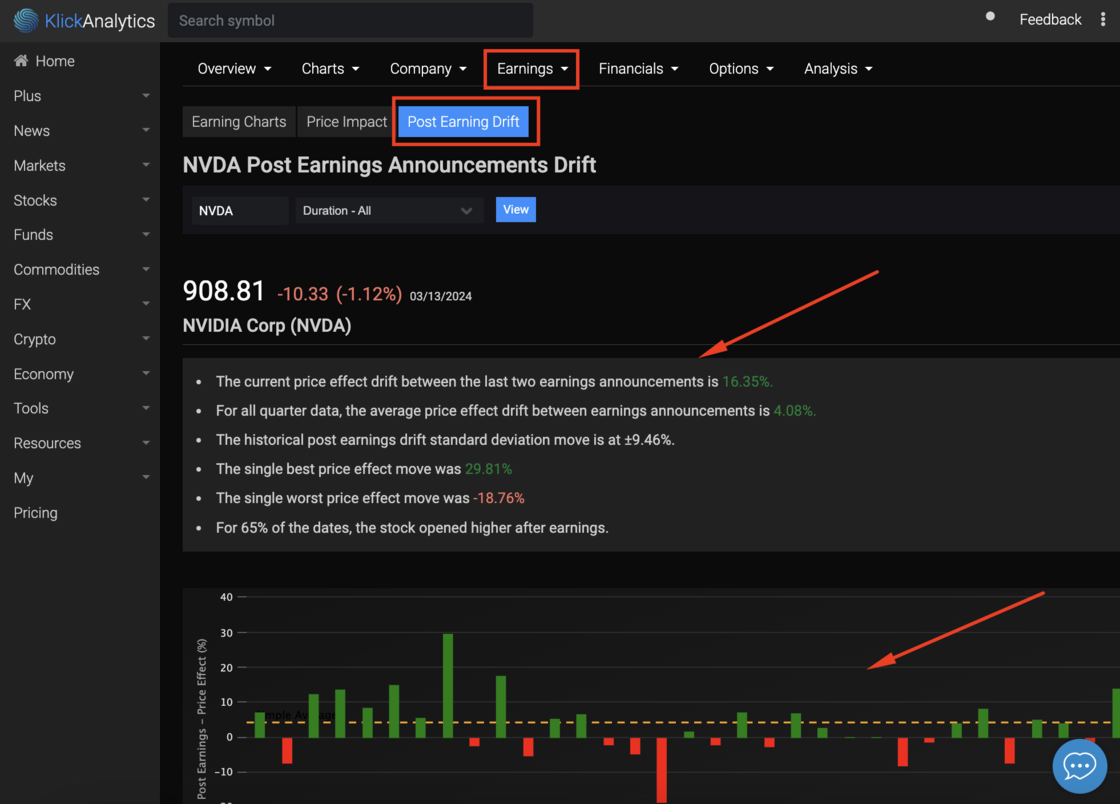
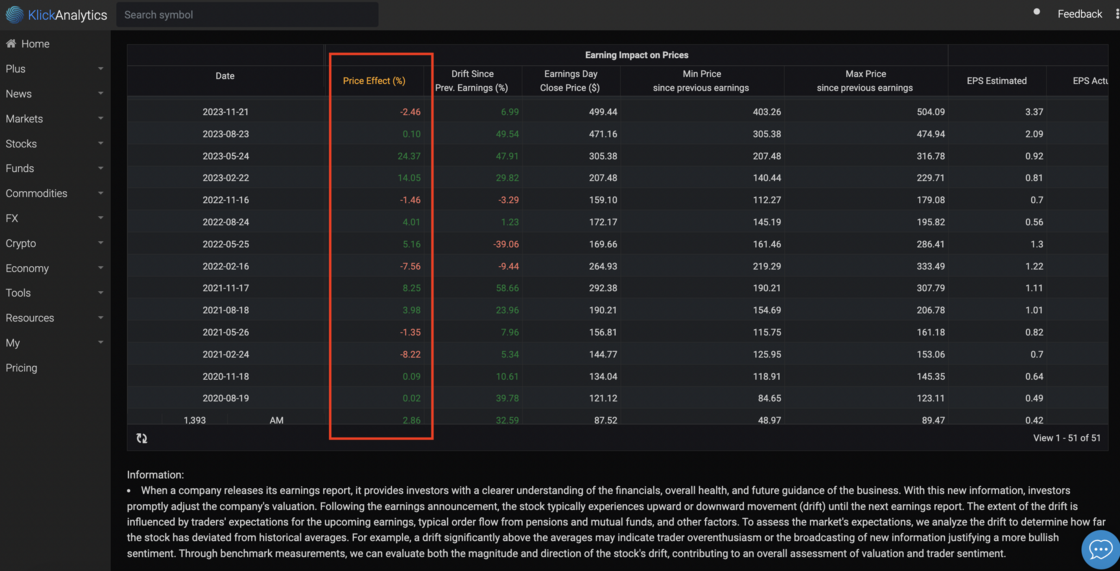
When a company reports earnings it gives investors more clarity into the financials, overall health, and forward guidance of the business. Given the new information, investors can quickly reprice the company's value. After earnings, the shares typically move up or down (drift) until the next earnings announcement. The magnitude of the drift will be based on traders' expectations of the next earnings, typical order flow from pensions and mutual funds, etc. In order to gauge the market's expectations, we measure the drift to determine how far away the stock has moved from historical averages. For instance, if the drift is way above the averages, it can indicate trader over enthusiasm or that new information has been telecast to warrant a more bullish sentiment. By measuring benchmarks, we can assess the magnitude and direction of the stock's drift as part of the overall valuation and trader sentiment.
To access: Search for any company say NVDA, and then from the top symbol menu, select Earnings > Price Impact > Post Earning Drift
Earning Historical Charts
We've added a new app 'Earning Historical Charts' which allows a user to quickly view a company historical earning performances in a visual chart style. The app allows to view historical earnings based on;
- Earnings - Opening Gaps
- Earnings - Actual Moves on earning date
- Earnings - Returns (%) on earning date
- Earnings - Open to Close (%) on earning date
- Earnings - High to Open (%) on earning date
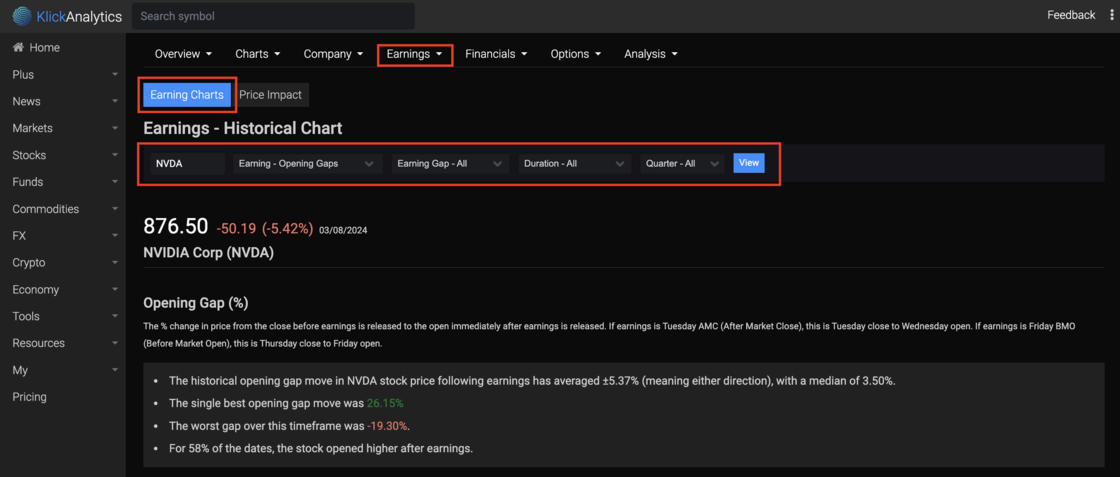
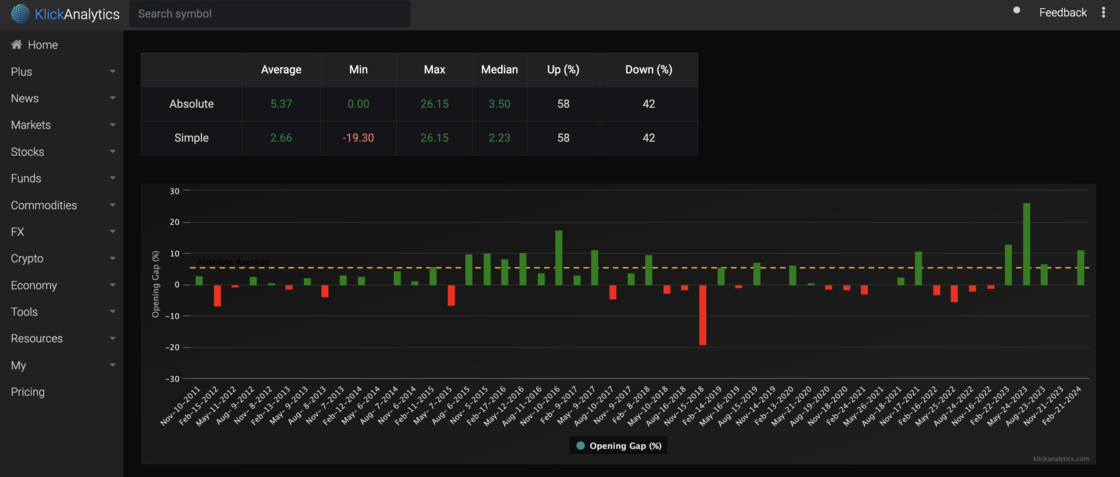
The above app will help the user to find trade oppourtunities within earning season for a company and much more.
To access: Search for a company say NVDA, and then from the top menu, select Earnings > Earning Charts