What's New
Product updates, improvements and fixes across the KlickAnalytics platform.
Explore companies financial key metrics and trends!
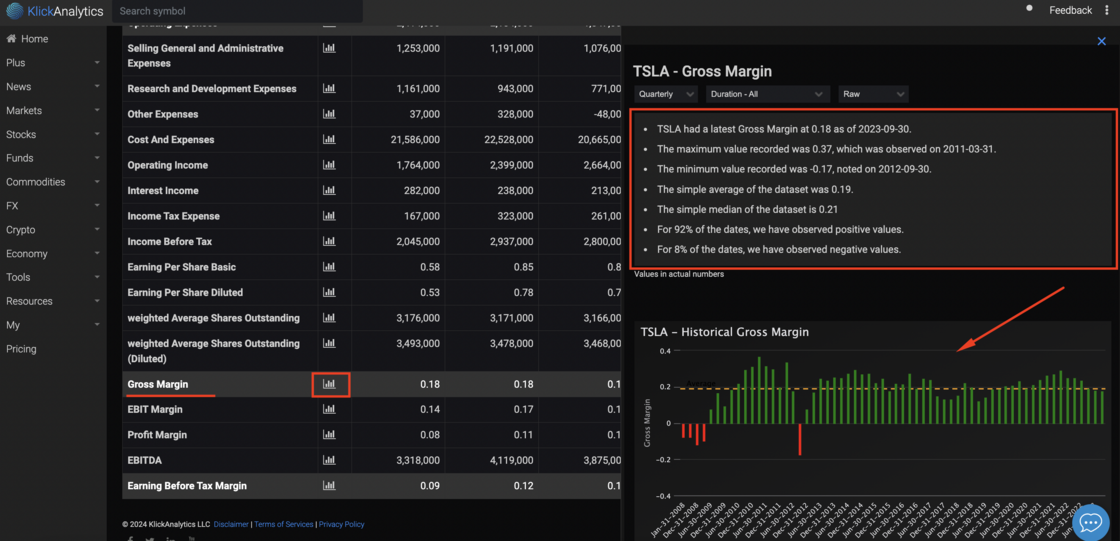
In response to user feedback and evolving industry standards, we're excited to introduce new features and enhancements to our financial statement analysis application. These updates are designed to provide users with more comprehensive insights, improved usability, and enhanced visualization capabilities.
1. Expanded Line Item Analysis:
Users can now view a wide range of financial statement line items such as gross margins, operating expenses, net income, and more. This expanded coverage allows for a deeper understanding of key financial metrics crucial for decision-making.
2. Historical Trends:
Our application now offers historical trend analysis, enabling users to track the performance of selected line items over time. From quarterly to annual views, users can identify trends, spot anomalies, and make informed projections based on past performance.
3. Flexible Observation Filters:
To cater to diverse analytical needs, users can filter observations based on customizable timeframes ranging from the last 3 months to the last 12 months or view all available data. This flexibility allows for focused analysis and quick comparisons across different periods.
4. Key Statistics:
We've introduced a new feature that provides users with key statistics for selected line items. From mean and median values to standard deviations and percentiles, users can gain deeper insights into the distribution and variability of financial data.
5. Enhanced Visualization:
A new historical bar chart visualization has been added to the application, allowing users to visualize positive and negative values over time. This dynamic visualization helps users identify trends, patterns, and outliers at a glance, enhancing the interpretability of financial data.
Conclusion:
With these updates, our financial statement analysis application empowers users to conduct comprehensive analyses, uncover valuable insights, and make well-informed decisions. We remain committed to continuously improving our platform to meet the evolving needs of our users and provide them with the tools they need to succeed in financial analysis.
To access: Search for a company say TSLA, then from the symbol menu, select Financials > Fundamentals > and then click on any of the chart icon against any line item like Gross Margin to view the analysis.