What's New
Product updates, improvements and fixes across the KlickAnalytics platform.
Seasonal Trades Analysis
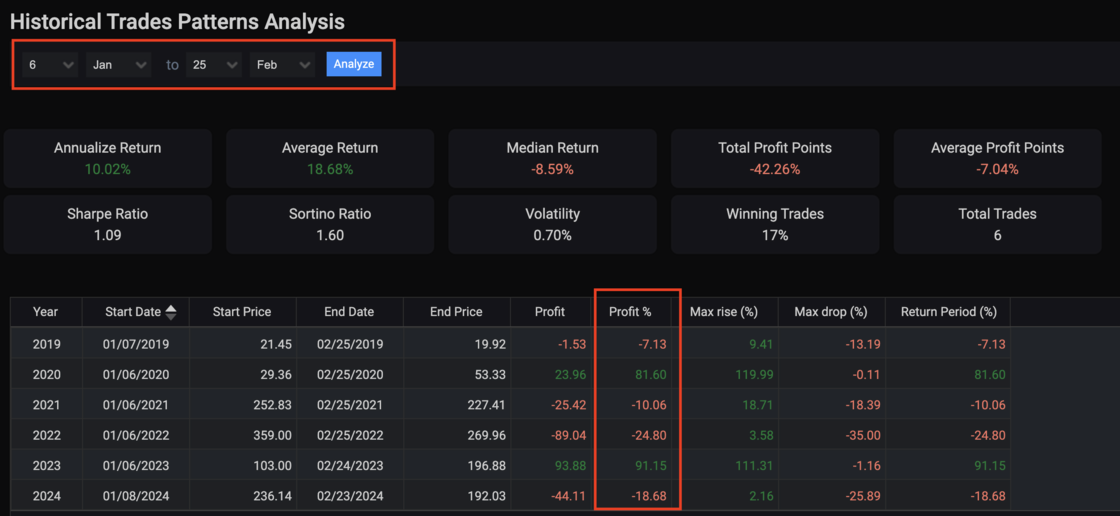
We’re excited to introduce app called Historical Trades Patterns Analysis tool, offering enhanced flexibility and deeper insights into your trading analysis.
Our users can select custom start and end days across different months and years, allowing you to explore trade patterns over any specific time period that interests you. Additionally, we’ve added the ability to filter and customize key metrics such as profit percentage, max rise/drop, Sharpe ratio, and volatility, making it easier for you to focus on the data that matters most.
Interactive charts now update in real-time as you adjust your date range or metrics, giving you a visually engaging way to spot trends and patterns instantly. A new performance summary section has also been added to quickly highlight key takeaways, providing a snapshot of your selected time frame's most critical metrics.
To view: search a symbol say TSLA, and then from the top menu, select Analysis > Seasonality > Trades