What's New
Product updates, improvements and fixes across the KlickAnalytics platform.
118 updates · clear
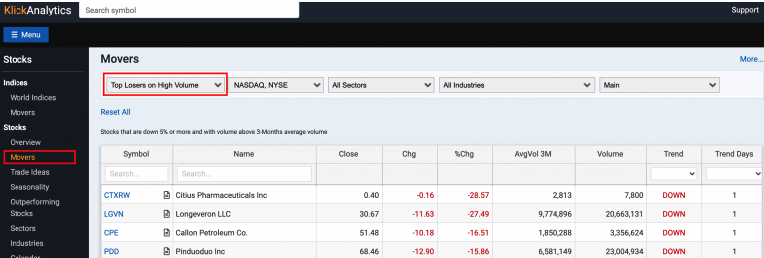
Automated data news for you!
KlickAnalytics is a data company. We always look at ways and means to help our users to uncover data insights and more. With that, we've added a new app called 'Data News'.
Data News is a internal robot that will scan current and historical market data and find all important event. The information are organized into various reports like;
Top Volume Leaders
Top Gainers ($)
Top Gainers (%)
Top Losers ($)
Top Losers (%)
Sector Performances
Top/Bottom - Open to Close Gaps
Top/Bottom - High to Close Gaps
Top/Bottom - Low to Close Gaps
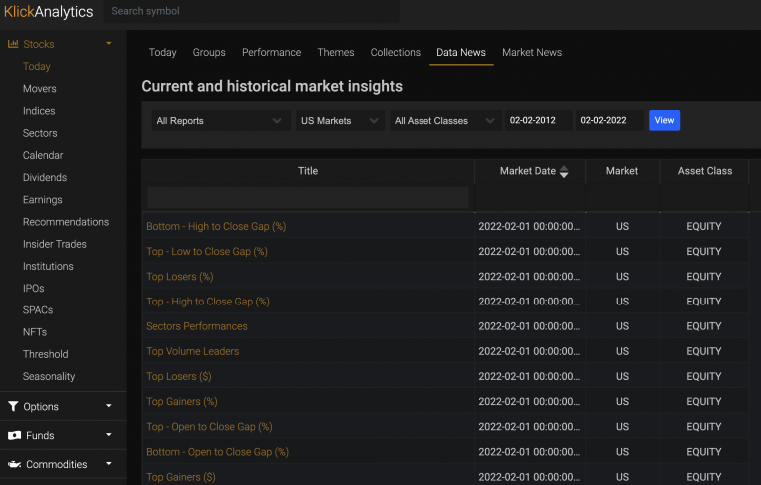
We are constantly adding more and more reports for our users. To access all these reports, we have provided a simple interface where our users can select a report type, market, asset class type and even defined a custom date range to view all reports for that date and more.
These reports are calculated at the end of the market. We have these reports compiled from year 2000 onwards. Currently we have around 55,000+ reports stored in our system and we are adding more and more.
To view: From the left menu, click Stocks > Today > Data News
Global symbol search with exchange information
KlickAnalytics provide global financial markets information with thousands of companies traded in multiple exchanges. We've enhanced our auto-complete search functionality so that when you search a symbol, it will display;
Symbol Name
Exchange/Country short name
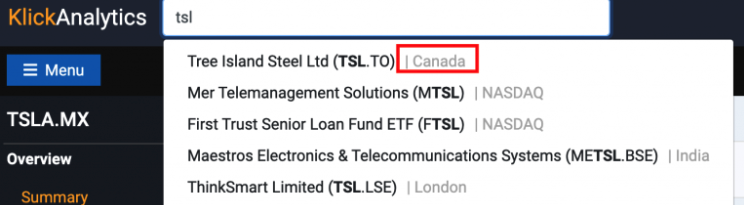
Now you can see both the symbol name and its associated exchange or country information within auto-complete.
To access: From the top bar, search any global symbol.
Market FAQs
Investors always look at finding answers from the market, so to solve this problem, we've created a new app called 'Markets FAQs', where;
We will list the most common questions, an investor normally seek
These questions will be grouped into several categories like Global Markets, Company Analysis, Recommendations, and more.
Our user can filter FAQs based on;
categories,
filter results with search or
even look at FAQs which contains a video walkthrough
For each FAQ, when click will lead you to the respected KlickAnalytics app for an answer
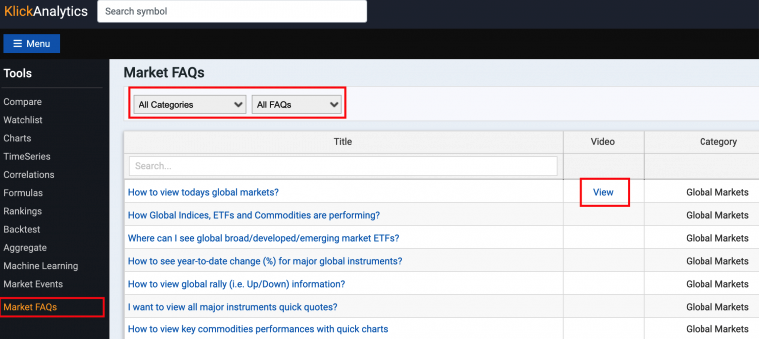
We have around 100+ common market FAQs at the moment, and we will be adding more investors' FAQs more and more.
To access: Click on Menu > Market FAQs
Filter best stocks by fundamental ratings
Fundamental analysis plays an important role in evaluating a company strengths and more. Now you can filter best stocks by fundamental ratings and more.
We take the following fundamental data items in our calculations;
DCF - Discounted Cash Flow
ROE - Return on Equity
ROA - Return on Assets
Debt to equity ratio
Price to earnings ratio
Price to book ratio
For a detail explanation of the calculations, click here.
We will have the following ratings for each US listed companies
Strong Buy
Buy
Neutral
Sell
Strong Sell
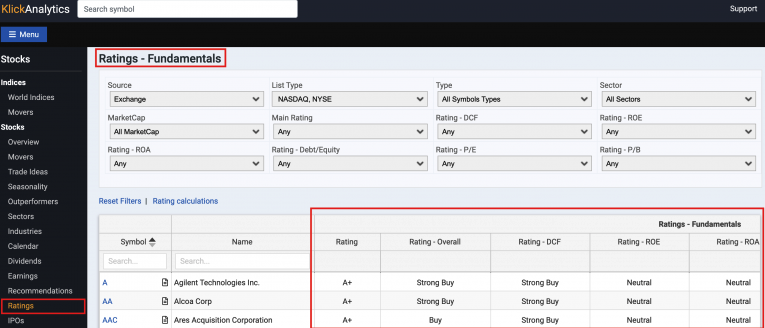
You can view ratings based on;
Total Rating
Rating - DCF
Rating - ROE
Rating - ROA
Rating - Debt/Equity
Rating - Price to earning ratio
Rating - Price to book ratio
You can even filter the records based on an exchange, sector, companies within an index, themes based companies, or even watchlist.
To access: From the top menu, click Menu > Ratings
Please note that the above ratings are purely for education purpose and does not constitute any recommendations of any type of trading at all. Please take this purely for education purposes only.
View all historical earning call transcripts
We've added a new app which allows you to look at current and historical earnings call transcript for all US listed companies.
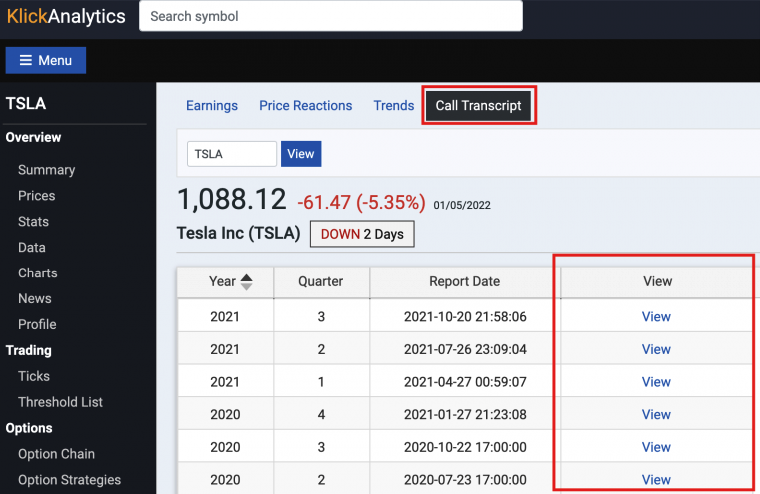
KlickAnalytics provides call scripts from 2006 onwards for companies.
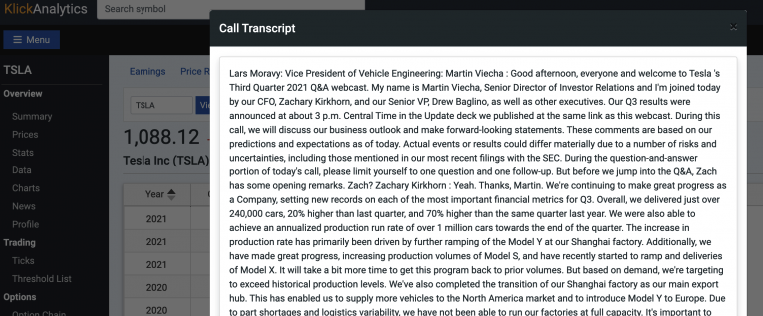
Now our users can access all the earnings call transcripts to see actual call details for even further analysis.
To access: Search for a company say TSLA, and then from the left symbol menu > Earnings > Call Transcript
Visualization - Group stats
We've enhanced our visualization tool to display Group stats based on your own selection of stocks and more.
This feature is available by selection the view type drop down and then select 'Stats'.
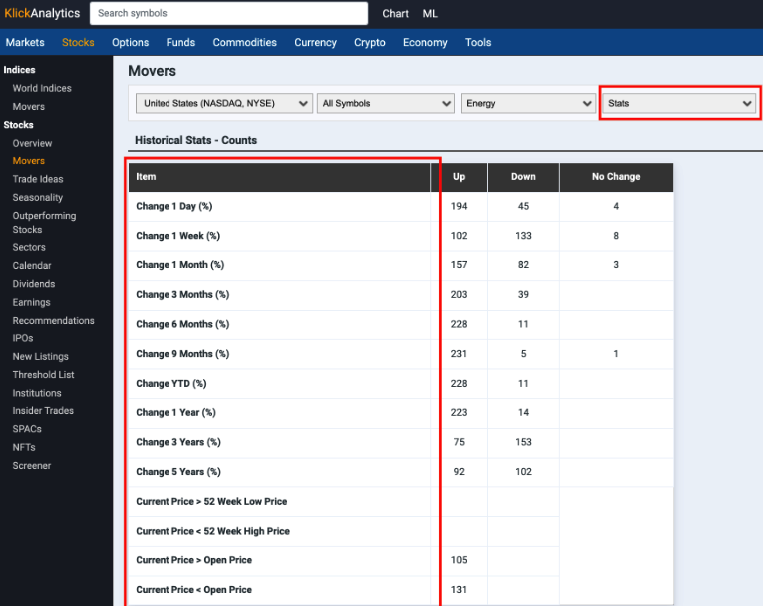
In addition, this feature is added to all applicable apps ie. at movers, stocks, screeners, watchlist and more.
The stats will run stats on all the symbols based on the user selection and will give the following data;
Toal Up / Down and No change counts for;
Change (%)
Change 1 Day (%)
Daily Change 1 Week (%)
Change 1/3/6/9 Months (%)
Change 1/3/5 Years (%)
52 Week High / Low
of stocks where current price > 52 week high price
of stocks where current price < 52 week low price
Open / Close Prices
of stocks where current price > open price
of stocks where current price < open price
To access: From the top menu, select stocks, and then in the app, click on Main drop down and select 'Stats'
View Historical Standard Deviations for global symbols
KlickAnalytics calculates a lot of derived data from market data. We just updated our volatility app to include historical standard deviations with the following periods;
1 Week
20 Days
1 Month
3 Months
100 Days
6 Months
9 Months
Year-to-date
1 Year
3 Years
and 5 Years
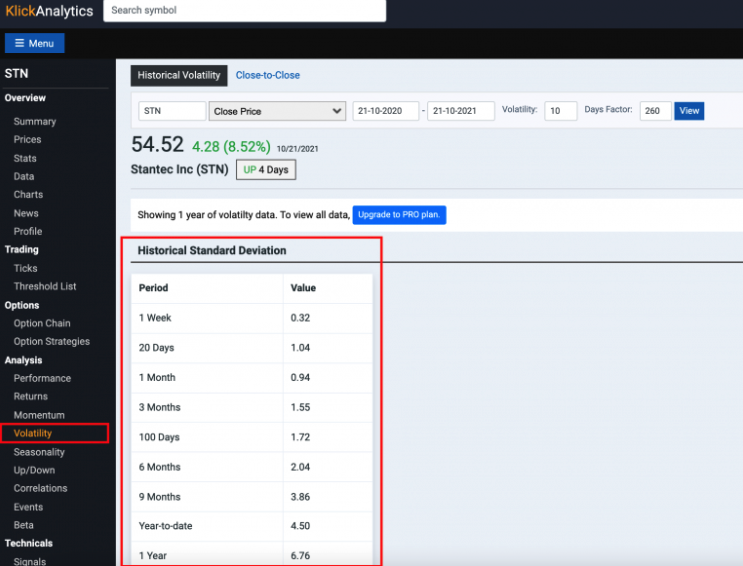
Defining price movement in terms of standard deviations is preferable to using percentage change because using standard deviations puts all the stocks on a level playing field. There are categories of stocks that are typically more volatile and have larger percentage price changes than other stocks. For example, low-priced small-cap stocks or high-tech stocks are typically much more volatile than lower volatility stocks such as utility stocks. If we used percentage change to define price movement, then high-volatility stocks would always dominate the list and we would miss lower-volatility stocks that might have an unusually large movement on a particular day.
This will allow our users to view price movements of any global symbol in terms of historical standard deviations and much more.