What's New
Product updates, improvements and fixes across the KlickAnalytics platform.
View Historical Standard Deviations for global symbols
KlickAnalytics calculates a lot of derived data from market data. We just updated our volatility app to include historical standard deviations with the following periods;
1 Week
20 Days
1 Month
3 Months
100 Days
6 Months
9 Months
Year-to-date
1 Year
3 Years
and 5 Years
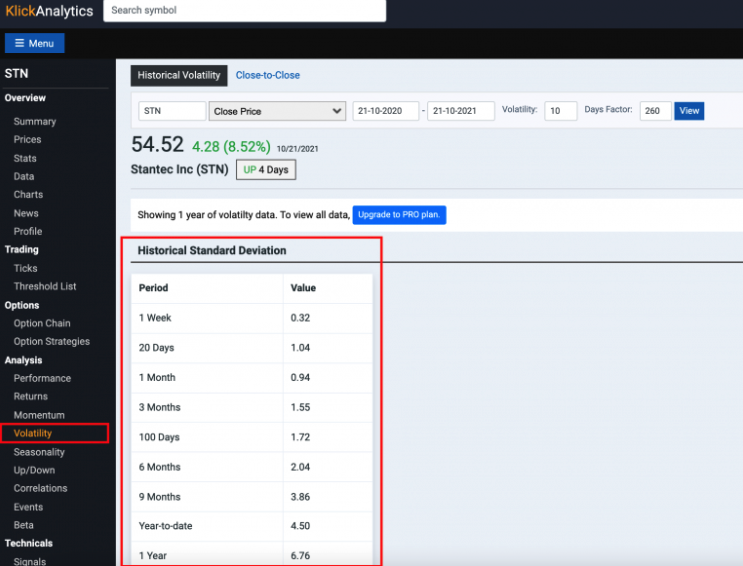
Defining price movement in terms of standard deviations is preferable to using percentage change because using standard deviations puts all the stocks on a level playing field. There are categories of stocks that are typically more volatile and have larger percentage price changes than other stocks. For example, low-priced small-cap stocks or high-tech stocks are typically much more volatile than lower volatility stocks such as utility stocks. If we used percentage change to define price movement, then high-volatility stocks would always dominate the list and we would miss lower-volatility stocks that might have an unusually large movement on a particular day.
This will allow our users to view price movements of any global symbol in terms of historical standard deviations and much more.