What's New
Product updates, improvements and fixes across the KlickAnalytics platform.
Visualization - Group stats
We've enhanced our visualization tool to display Group stats based on your own selection of stocks and more.
This feature is available by selection the view type drop down and then select 'Stats'.
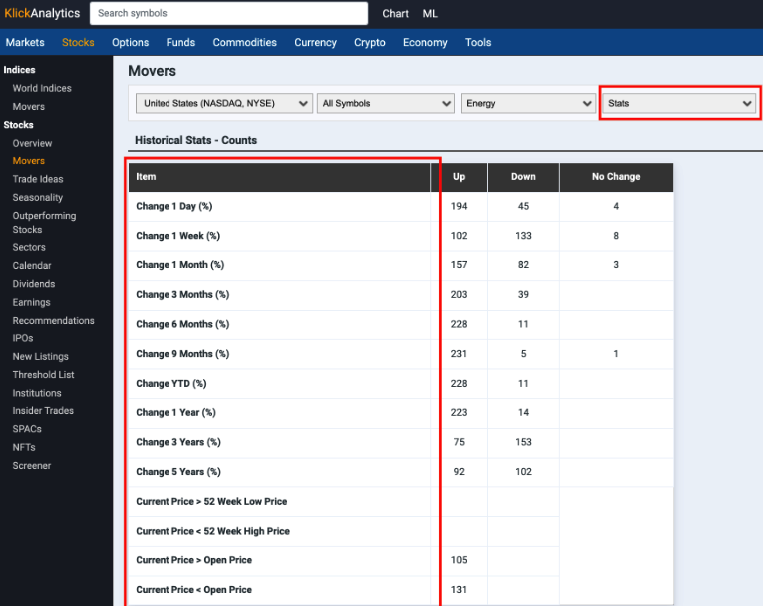
In addition, this feature is added to all applicable apps ie. at movers, stocks, screeners, watchlist and more.
The stats will run stats on all the symbols based on the user selection and will give the following data;
Toal Up / Down and No change counts for;
Change (%)
Change 1 Day (%)
Daily Change 1 Week (%)
Change 1/3/6/9 Months (%)
Change 1/3/5 Years (%)
52 Week High / Low
of stocks where current price > 52 week high price
of stocks where current price < 52 week low price
Open / Close Prices
of stocks where current price > open price
of stocks where current price < open price
To access: From the top menu, select stocks, and then in the app, click on Main drop down and select 'Stats'