What's New
Product updates, improvements and fixes across the KlickAnalytics platform.
View pivot points for global symbols
We've added a new view called 'Pivot Points' which is available for all data tables. The view will give the following information;
Pivot Points
Support level 1 (S1)
Support level 2 (S2)
Support level 3 (S3)
Resistance level 1 (R1)
Resistance level 2 (R2)
Resistance level 3 (R3)
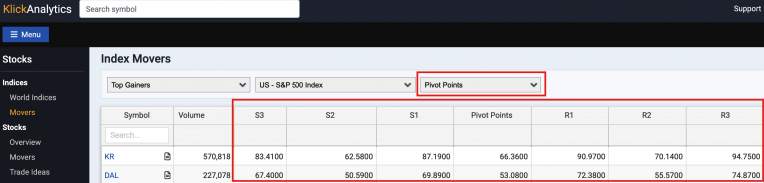
With the above, you can see price trends and related pivots support and resistance levels and more.
To access: From any of the data tables, click on views drop down called 'Main' and then select 'Pivot Points'
Movers > Added Top ETFs Stocks
We've added a new filter to view all Top performing ETFs in our movers app.
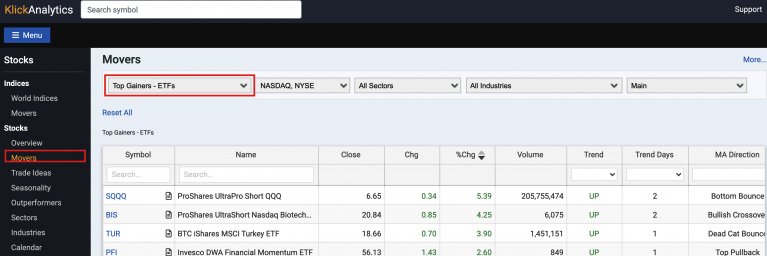
To access: Click on Menu > Movers > Top Performing ETFs
Movers > View breakout stocks
We've added a new filter in out movers app, that will allow you to look at stocks that are in the breakout formation. We will have two ways to look at breakout stocks;
Breakout - positive
Where stocks price moving above its 20-Days simple moving averages
Breakout - negative
Where stocks price moving below its 20-Days simple moving averages
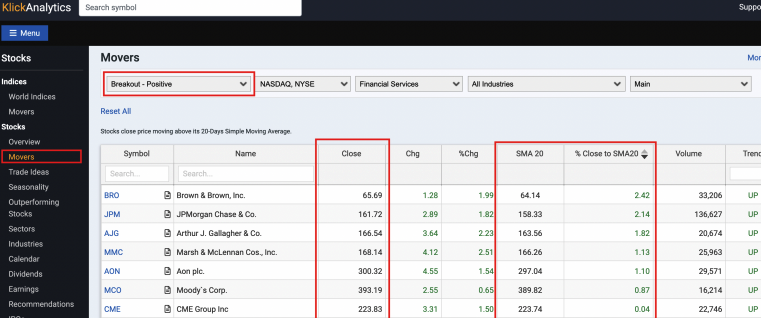
In addition, we also display a column with values for % Change from Close price to 20-Day simple moving averages.
To access: Click on Menu > Movers, and then select from the drop down for either 'Breakout - positive or Breakout - Negative option'
View Dividend reports for Units and Close End Funds
We've added the following two new reports in our 'Dividend Reports' app;
Dividend Report - Units
Dividend Report - Close End Funds
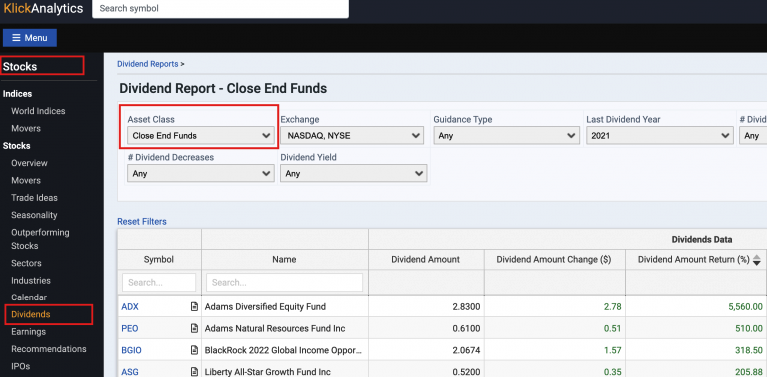
This report will display all the dividend related information as per companies selected as either REIT, Units or Close End Funds.
To access: Click on Menu > Dividends > Dividends Reports
View top 1 week, 1/3/6/9/1 year top performing stocks
We've added the following additional movers views to our movers app;
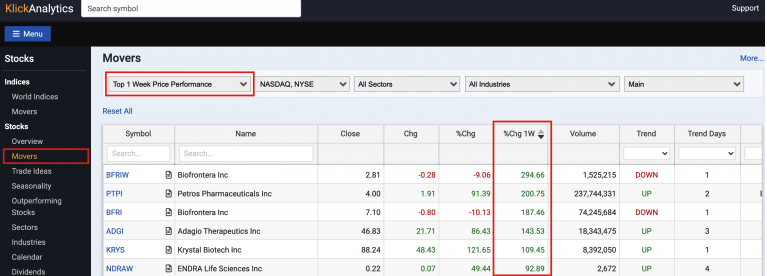
Top 1 Week price performance
Top 1/3/6/9 Months price performance
Top Year-to-date price performance
Top 1 Year performance
The above will allow you to quickly view the best performance stocks based on the period you select at a glance.
To access: Click on Menu > Movers. Select the first drop down and select say '1 Week Price Performance'
Screener - Filter stocks with Moving Average Directions
We've added a new filter in our screener, that will allow you to filter records based on moving average trend directions. The options are;
Uptrend
Downtrend
Bullish Crossover
Bearish Crossover
Fast Bullish Crossover
Fast Bearish Crossover
Bottom Bounce
Top Pullback
Dead Cat Bounce
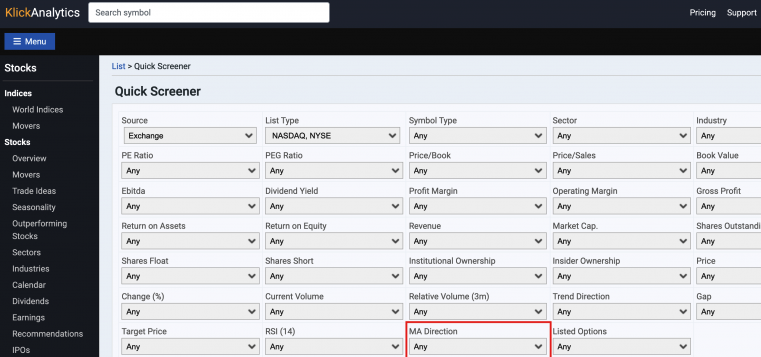
To access: Click on Menu > Screener, and then select from 'MA Direction'
Movers > Stats for moving averages
We've added a new enhancement to our platform, where from any of our data table, you will be able to view to the total stats/counts for all possible moving average directions.
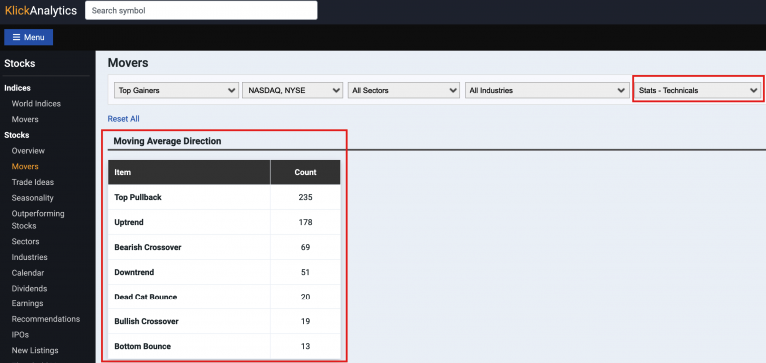
This will help you to look at overall technical directions on your group of instruments and more. This enhancements is applicable to all data tables, and apps like movers, screeners, watchlist and more.
To access: Click on Menu > Movers, and then from the view drop down called 'Main', select 'Stats - Technical'.
Movers > View total stats for moving average directions like uptrends, downtrends...
We've added a new enhancement to our platform, where from any of our data table, you will be able to view to the total stats/counts for all possible moving average directions.
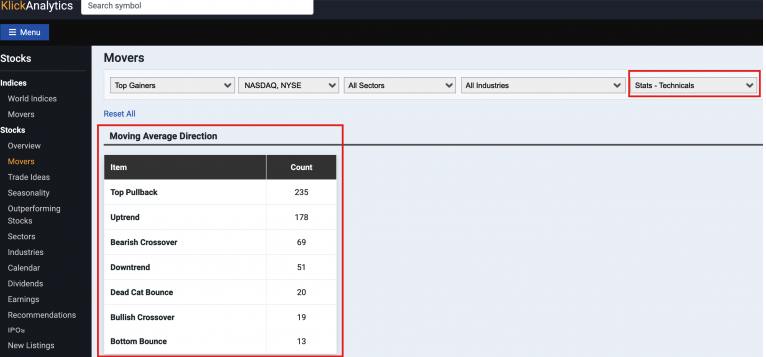
This will help you to look at overall technical directions on your group of instruments and more. This enhancements is applicable to all data tables, and apps like movers, screeners, watchlist and more.
To access: Click on Menu > Movers, and then from the view drop down called 'Main', select 'Stats - Technical'.
View Moving average technical direction
KlickAnalytics calculates hundred of calculation on pricing, technical and fundamental data. We've added additional calculations to calculate the direction of the moving averages for major patterns.
You can access this information from any of our data table in the column called "MA Direction".
image.png
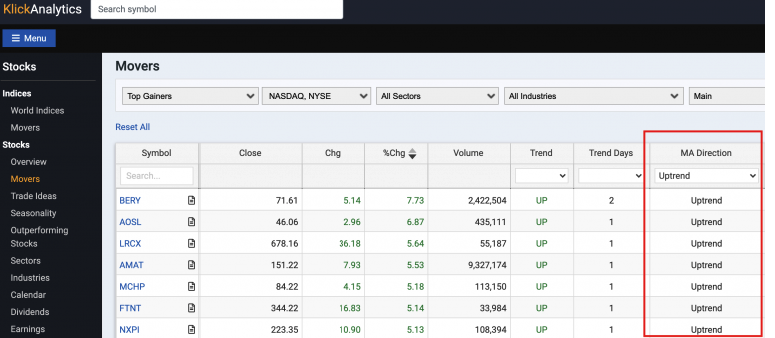
The "MA direction" can have following possible values;
Uptrend
- Current price above 20-day MA
- 20 MA above 50 MA
- 50 MA above 250 MA
Downtrend
- Current price below 20-day MA
- 20 MA below 50 MA
- 50 MA below 250 MA
Bullish Crossover
- Current price above 20-day MA
- 20 MA above 50 MA
- 50 MA below 250 MA
Bearish Crossover
- Current price below 20-day MA
- 20 MA below 50 MA
- 50 MA above 250 MA
Fast Bullish Crossover
- Current price above 20-day MA and 50 MA
- 20 MA below 50 MA
- 50 MA below 250 MA
Fast Bearish Crossover
- Current price below 20-day MA and 50 MA
- 20 MA above 50 MA
- 50 MA above 250 MA
Bottom Bounce
Current price above 20-day MA 20 MA below 50 MA and 250 MA 50 MA below 250 MA
Top pullback
- Current price below 20-day MA
- 20 MA above 50 MA and 250 MA
- 50 MA above 250 MA
Dead Cat Bounce
- Current price below 20-day MA, 50 MA, 250 MA
- 20 MA above 50 MA
- 20 MA below 250 MA
- 50 MA below 250 MA
To access: Click Menu > Movers, and view the column called 'MA Direction'
Screener > Filter stocks with listed options
Now you can filter stocks which had listed options in our screener!
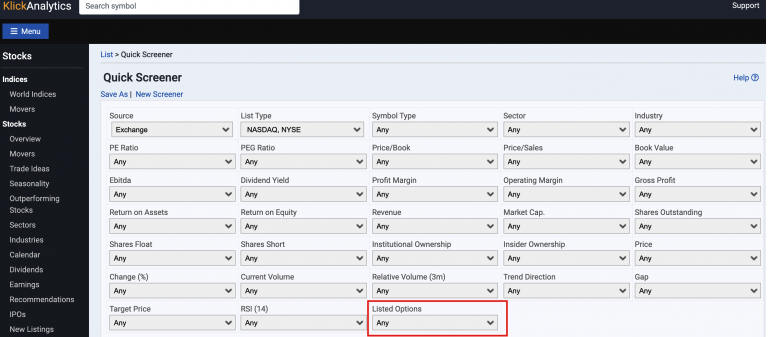
This will allow you to filter stocks with various criteria and be able to look at stocks with listed options.
To access: Click on Menu > Screener