← All product updates
What's New
Product updates, improvements and fixes across the KlickAnalytics platform.
View Moving average technical direction
New
Apr 21, 2022
KlickAnalytics calculates hundred of calculation on pricing, technical and fundamental data. We've added additional calculations to calculate the direction of the moving averages for major patterns.
You can access this information from any of our data table in the column called "MA Direction".
image.png
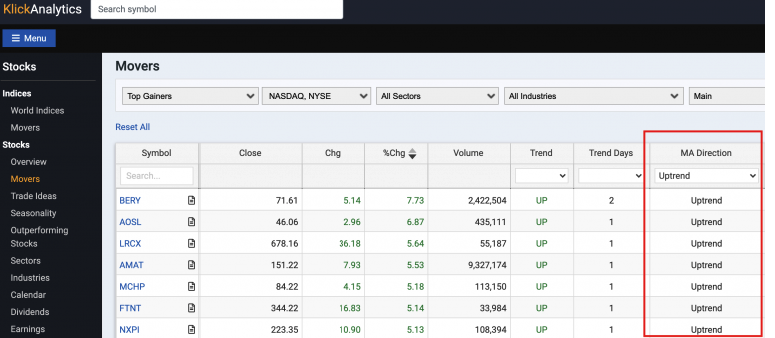
The "MA direction" can have following possible values;
Uptrend
- Current price above 20-day MA
- 20 MA above 50 MA
- 50 MA above 250 MA
Downtrend
- Current price below 20-day MA
- 20 MA below 50 MA
- 50 MA below 250 MA
Bullish Crossover
- Current price above 20-day MA
- 20 MA above 50 MA
- 50 MA below 250 MA
Bearish Crossover
- Current price below 20-day MA
- 20 MA below 50 MA
- 50 MA above 250 MA
Fast Bullish Crossover
- Current price above 20-day MA and 50 MA
- 20 MA below 50 MA
- 50 MA below 250 MA
Fast Bearish Crossover
- Current price below 20-day MA and 50 MA
- 20 MA above 50 MA
- 50 MA above 250 MA
Bottom Bounce
Current price above 20-day MA 20 MA below 50 MA and 250 MA 50 MA below 250 MA
Top pullback
- Current price below 20-day MA
- 20 MA above 50 MA and 250 MA
- 50 MA above 250 MA
Dead Cat Bounce
- Current price below 20-day MA, 50 MA, 250 MA
- 20 MA above 50 MA
- 20 MA below 250 MA
- 50 MA below 250 MA
To access: Click Menu > Movers, and view the column called 'MA Direction'