What's New
Product updates, improvements and fixes across the KlickAnalytics platform.
🚀 Introducing Seasonal Edge
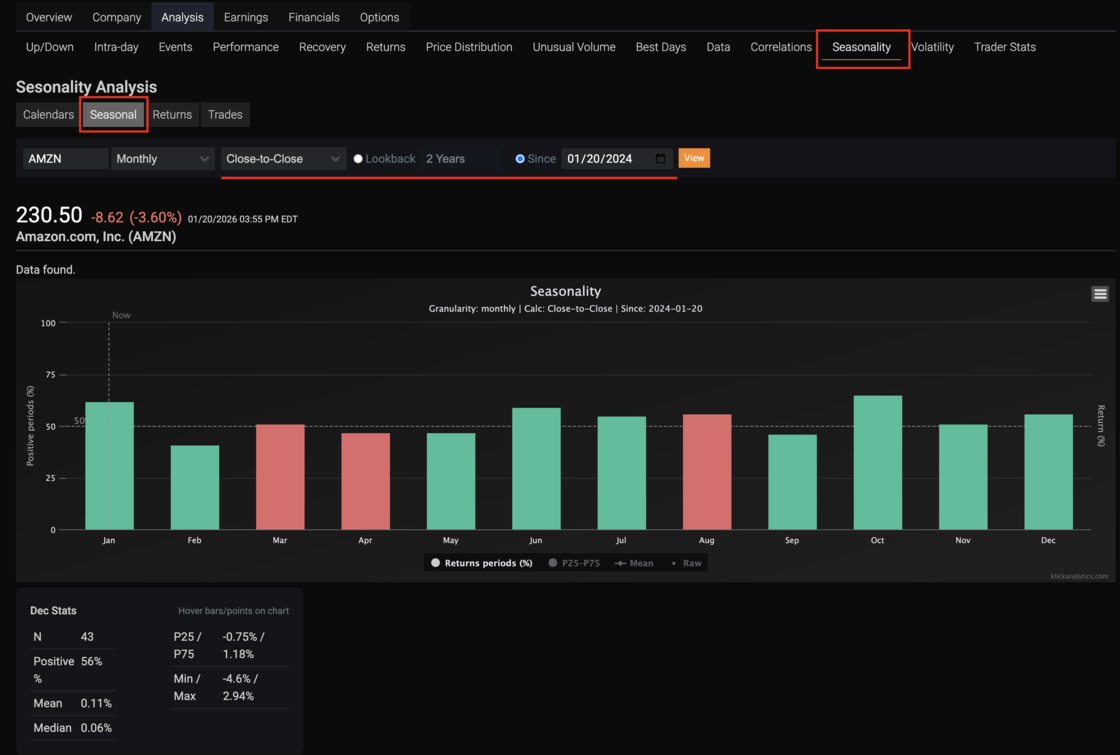
🚀 Introducing Seasonal Edge — Market Seasonality Done Right
We’re excited to launch Seasonal Edge, a powerful new tool inside KlickAnalytics that reveals how markets actually behave over time — backed by data, not anecdotes.
Seasonal Edge analyzes historical returns across months, weeks, and other time buckets to show when a symbol has historically performed better or worse, and by how much.
🔍 What makes Seasonal Edge different?
📊 Probability, not predictions
- See the percentage of positive vs. negative periods for each time bucket, clearly visualized in green and red.
📈 Real return distribution
- Go beyond averages with P25 / P75 bands, median, min/max, and raw return points — so you understand risk, not just direction.
🧮 Multiple return calculations
Close-to-Close
Open-to-Close
Log Returns
Switch instantly and see how seasonality changes.
⏱ Flexible time controls
- Lookback by years
Or analyze from a specific “Since” date
- Automatically limited for free users, fully unlocked for PRO
🧠 Context-aware insights
“Now” marker highlights the current period
Hover any bar or point to see detailed bucket statistics instantly
To view: Search for any symbol, click on Seasonality > Seasonal