What's New
Product updates, improvements and fixes across the KlickAnalytics platform.
Historical Seasonality by Years/Months
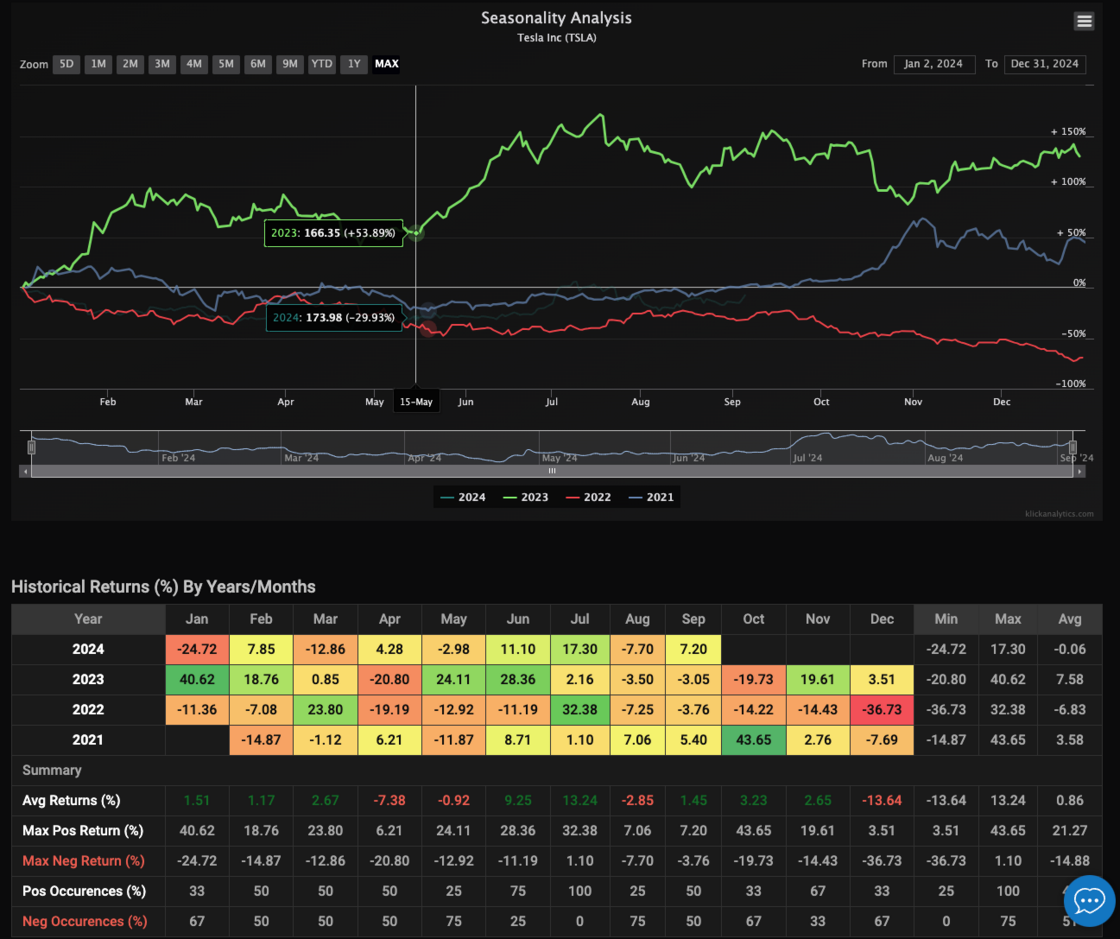
To enhance your experience and make data analysis more intuitive, we’re introducing several exciting product updates based on the historical returns table. First, we’re transforming the returns table into an interactive heatmap. This new feature will allow you to visually assess performance trends at a glance. By simply hovering over any month, you’ll gain immediate access to exact return values and year-on-year comparisons for that period, providing deeper insights without navigating through multiple screens.
Additionally, we’re introducing a new comparison tool where you can highlight or pin specific years, such as 2021, 2022, or 2023, for direct side-by-side analysis. This will make it easier for you to identify seasonal trends or significant performance shifts between years, helping you focus on the data that matters most to you. These updates are designed to make your workflow smoother and more efficient, empowering you to make well-informed decisions based on historical data trends.
To access: Search for any symbol say TSLA, from the top menu, select Analysis > Seasonality