← All product updates
What's New
Product updates, improvements and fixes across the KlickAnalytics platform.
Global 30-Day Markets Heatmap
New
Nov 17, 2025
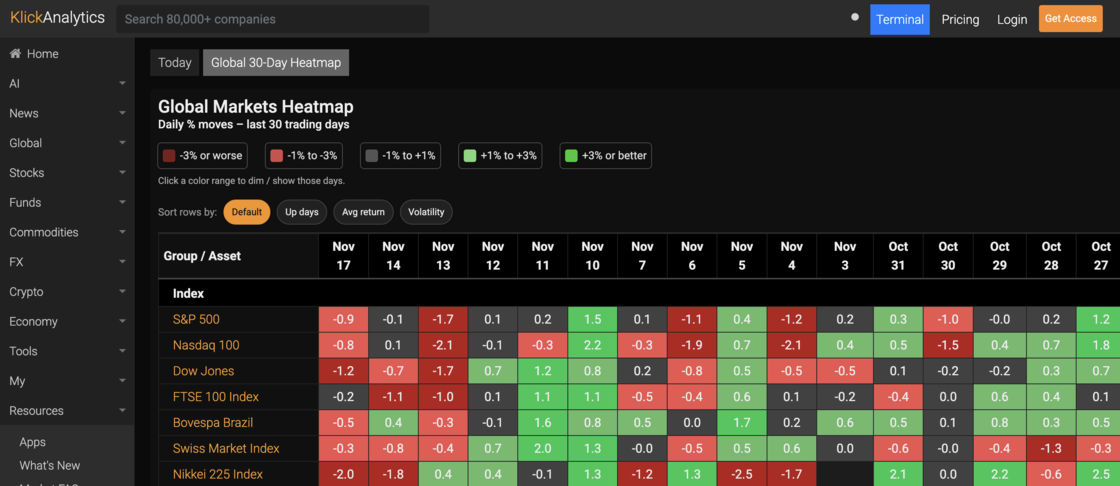
🚀 New in KlickAnalytics: Global 30-Day Market Wall
We’ve shipped a new dashboard tool designed to give you a true “terminal snapshot” of global markets in seconds.
What it does:
- Shows daily % moves for the last 30 trading days in a single heatmap
- Covers global indices, key commodities, crypto majors, agri contracts and FX pairs
- Groups assets by class so you can scan Commodities, Crypto, Currencies, etc. in one pass
- Lets you filter by move size using the color legend (e.g. focus only on +3% or worse days)
Lets you sort rows by:
- Up days (which assets have been consistently green)
- Average return (who’s trending)
- Volatility (where the real action is)
How to use it:
- 1) Open the “Global 30-Day Market Wall” in the dashboard.
- 2) Use the legend to highlight only the ranges you care about (for example, isolate the big selloff days).
- 3) Sort by Up, Avg, or Vol to surface opportunities or risks inside each group.
- 4) Click any asset name to jump straight into the full symbol view for deeper analysis.
This view is designed to be your new daily briefing:
one screen that tells you what’s been happening across the world in the last month – without opening ten different charts.
To access: From the Menu > Global > Today > Global 30-Day Wall