What's New
Product updates, improvements and fixes across the KlickAnalytics platform.
⚡ Formula Scanner — Visualize Trading Logic Like Never Before
We’ve just launched the Formula Scanner, a powerful new way to turn your trading logic into visual signals and actionable insights — directly on the chart.
🔍 What It Does
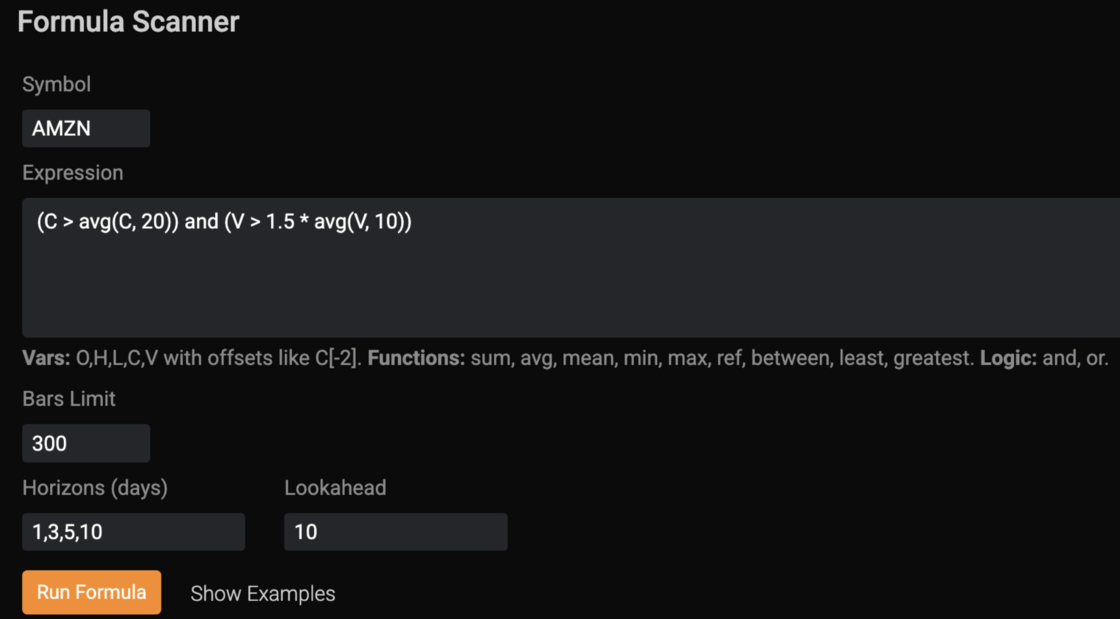
Define your very own custom trading condition using formulas with Open, High, Low, Close and Volume Prices like:
(C > avg(C, 20)) and (V > 1.5 * avg(V, 10))
Then click Run Formula — and the system will:
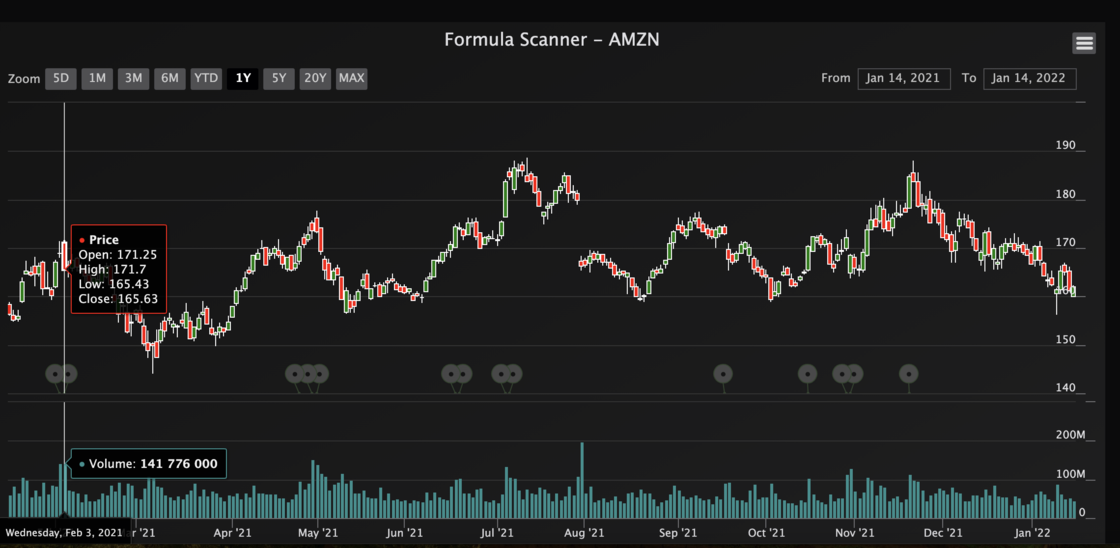
- Highlight matching events directly on the chart, showing every date your condition triggered.
- Generate detailed statistics across multiple horizons (1D, 3D, 5D, 10D) — including run-ups, drawdowns, and cumulative returns.
- List example events with full performance metrics for real backtesting context.
🧩 Features
Works with OHLCV data (O, H, L, C, V) and offsets like C[-2].
Supports built-in functions: sum, avg, mean, min, max, ref, between, least, greatest.
Logic operators: and, or, >, <, =, etc.
Dynamic horizons and lookahead windows for flexible event analysis.
Adjustable bars limit for faster scanning.
Full chart integration — see your signals visually, not just numerically.
📈 Benefits
Instantly test ideas — no need for complex coding or scripts.
See where your signal worked — visually on the price chart.
Understand performance distribution — best/worst runs, average outcomes, volatility after signal.
Turn formulas into trading logic that can evolve into automated strategies.
To access: From Menu > Tools > FormulaScanner
🔥 Now available in KlickAnalytics → Formula Scanner.
Build. Test. Visualize. — Your logic, your signals, your edge.